

Real-Time AI Spend with AI Signals
AI Signals gives your organization real-time visibility into AI spend across providers, models, and users, and connects that spend to the business context behind it.
AI Signals data feeds into CloudZero alongside your cloud and SaaS spend. Allocate AI costs using the same Dimensions and rules as everything else: by team, project, activity, or any category your organization defines.
Costs shown in AI Signals are estimates based on token volume at published market rates. These estimates are directional and can differ from reconciled billing data across the platform.
Coverage and capabilities are expanding. To get started, reach out to your account manager.
AI Signals has three tabs, each serving a different stage of the analysis workflow:
| Tab | What it does |
|---|---|
| Overview | Headline KPIs, spend breakdowns, model economics, and anomaly alerts in one cross-filterable view |
| Livestream | A real-time stream of individual AI inference events as they arrive |
| AI Explorer | Aggregated estimated spend analysis, grouped by two dimensions at once |
Overview
Overview consolidates AI cost, usage, and operational signals into one cross-filterable view, giving you situational awareness of your organization's AI spend without building a query or navigating between tools.
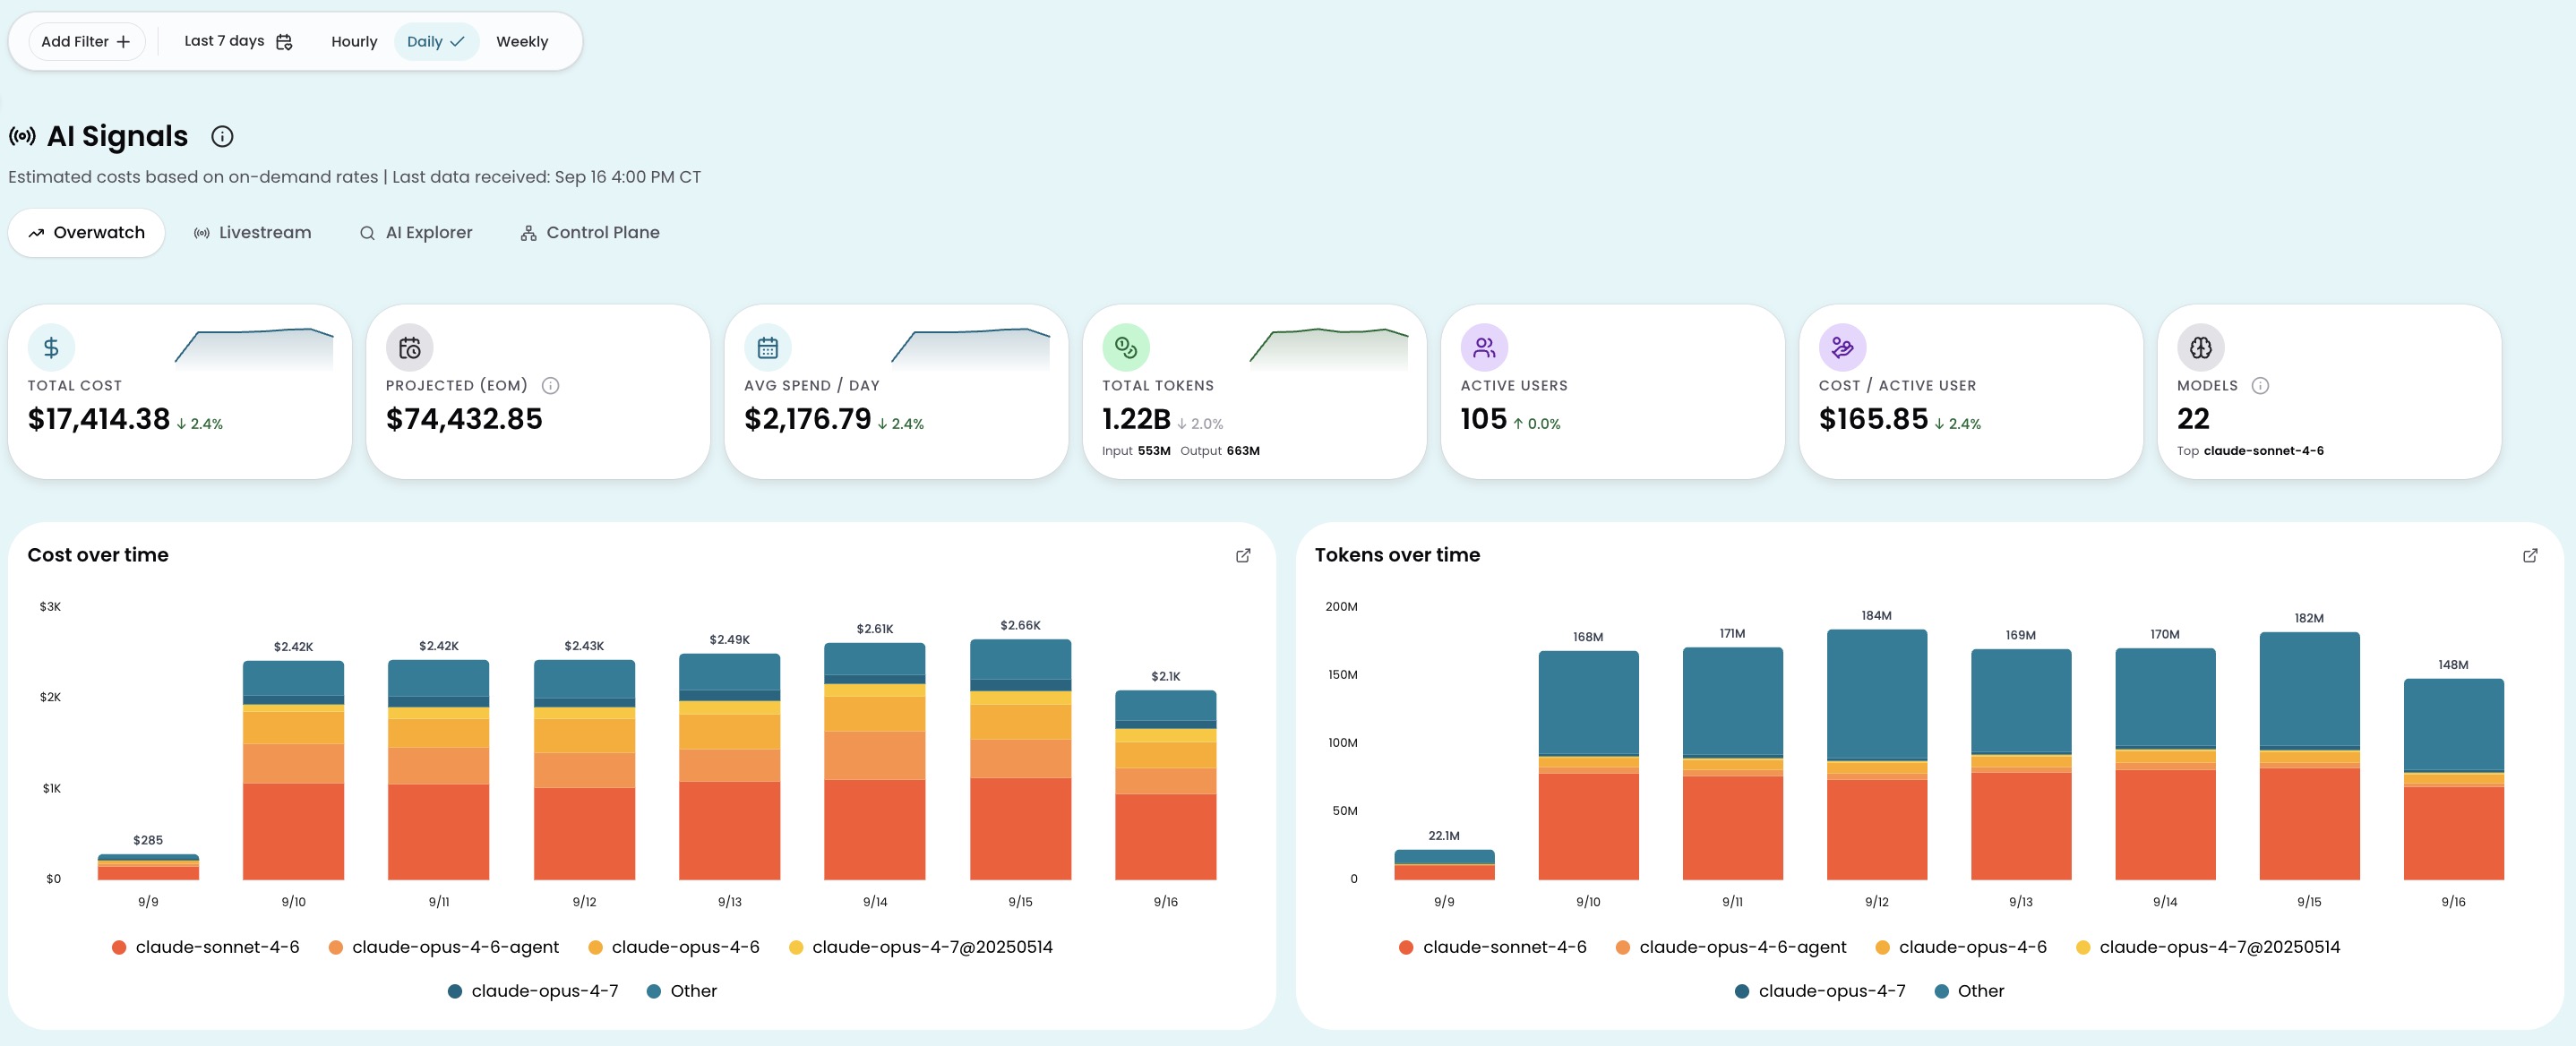
The Overview page includes the following panels:
- Headline KPIs: The top of the page shows total cost, projected end-of-month spend, active users, cost per active user, total tokens, and model count. Cost and token KPIs include trend sparklines and period-over-period deltas so you can spot trajectory changes at a glance.
- Cost and token consumption: Two side-by-side time series charts show cost over time and token consumption over time, both broken down by model.
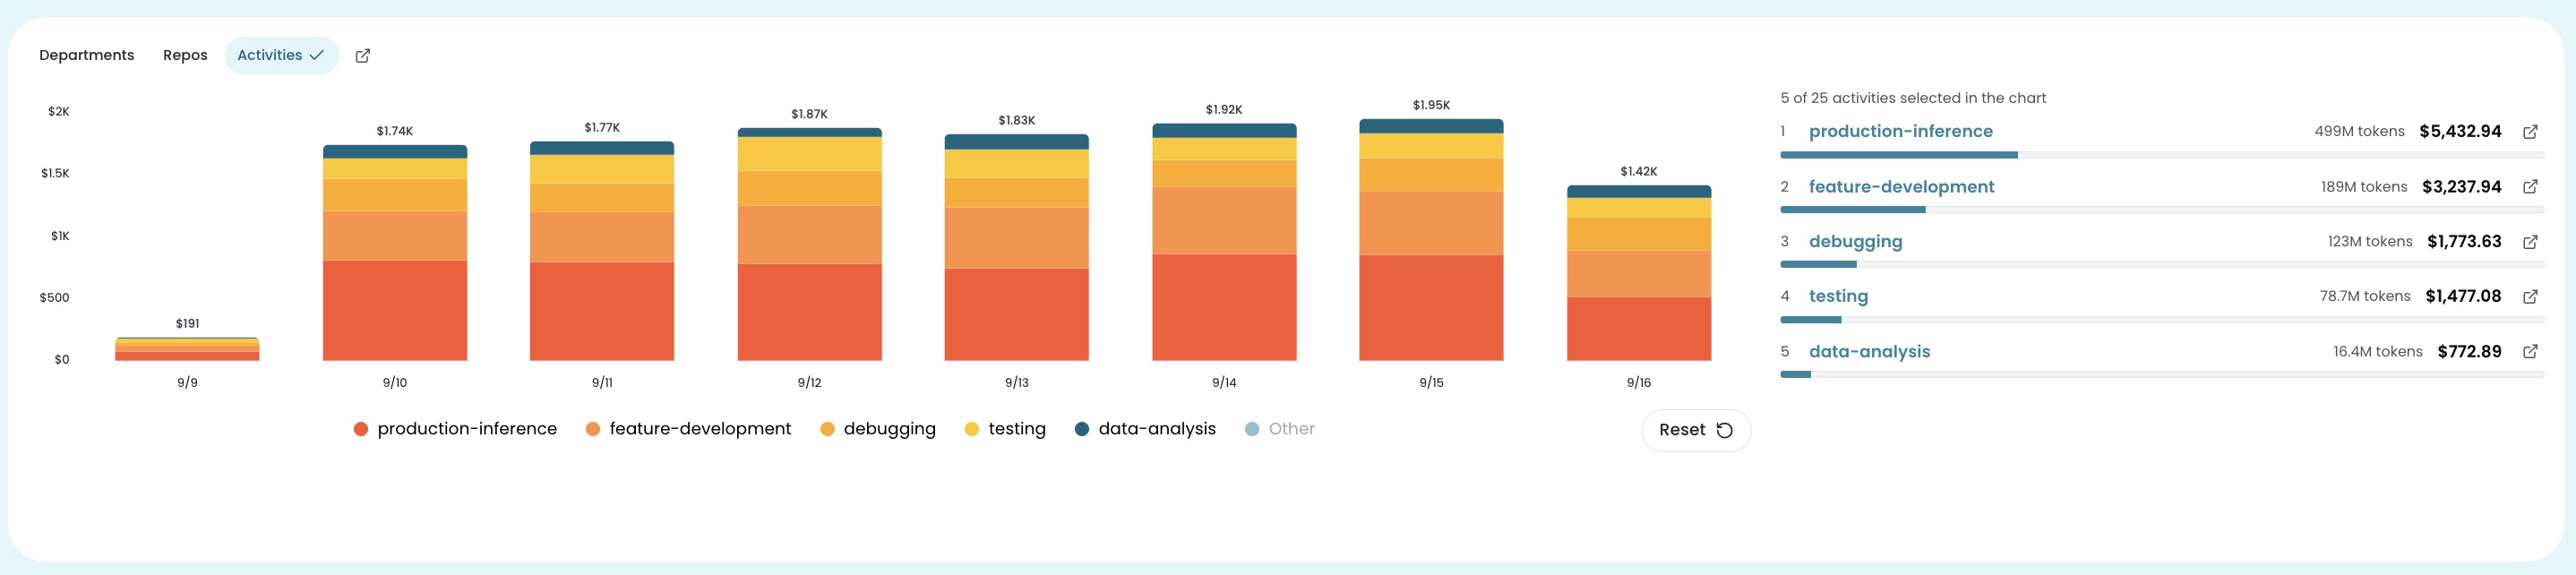
- Spend breakdown: Three tabs rank spend from highest to lowest: Departments (which organizational units are driving cost), Repos (which repositories are behind the spend), and Activities (what the work was, such as code review, debugging, or prospecting). Each tab shows a ranked table with cost and token counts.
- Anomalies: Active cost Incidents from the AI system Monitor appear alongside the spend data with sparklines showing the spend trajectory.
- Top users and top models: Top users ranks individuals by AI spend, with a Users tab and an Activities tab. Top models lists every model in use sorted by cost, showing total cost, token count, price per million tokens, and cache rate.
- Cache economics: Displays the cache-read share of total cost as a headline percentage, alongside a token-level breakdown showing where savings are landing across models.
Filtering and data availability
Click any row in the spend breakdown, top users, or top models panels to refilter the rest of the page to that slice, or use the Add Filter button to apply persistent filters.
Some breakdowns depend on data from your AI gateway or collector. If a panel shows an empty state, your data source is not yet sending that information. Reach out to your account manager for help configuring your setup.
Livestream
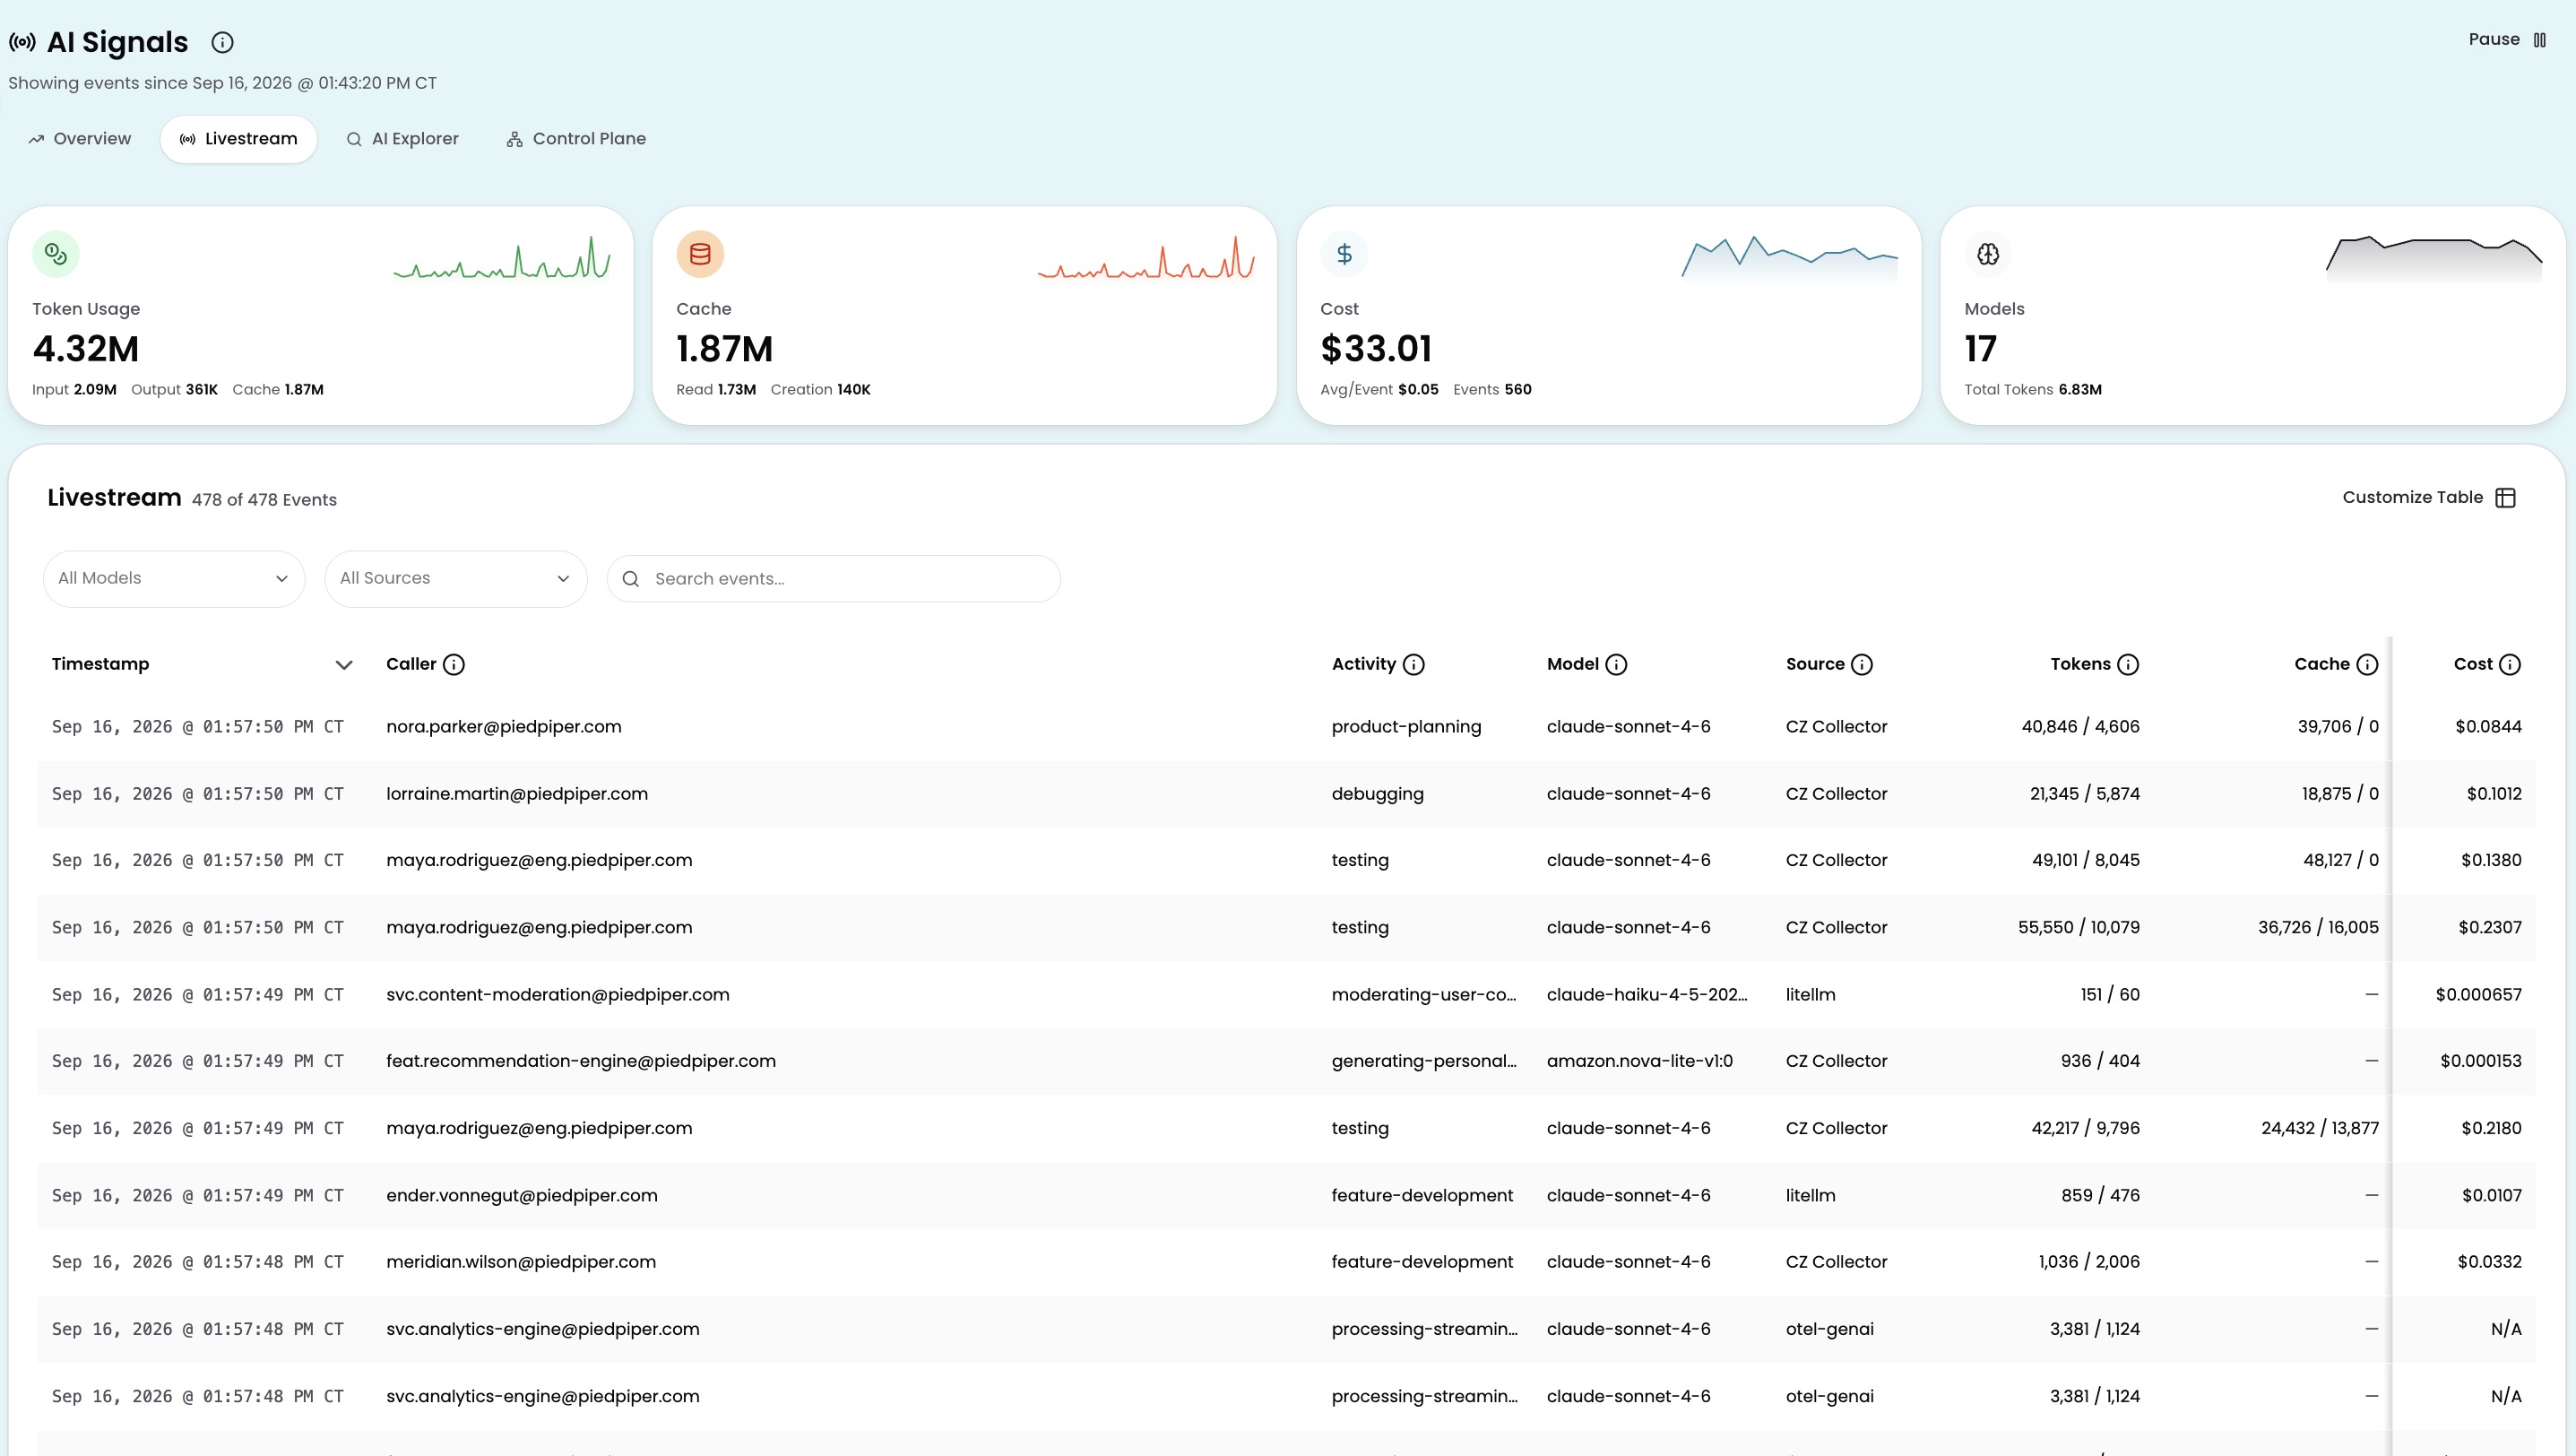
Livestream shows every AI inference event as it arrives, within seconds of the call being made. Each row is an individual event with context: who made the call, which model handled it, what the activity was, how many tokens it consumed, and what it cost.
Each event row shows timestamp, caller, model, source, tokens, cache, and cost by default. Additional columns (activity, department, team, project, topic, issue, tool, GitHub repo, git branch, and git user) are available through the Customize Table panel. The screenshot above shows the table with activity turned on.
Filter events by model or source using the dropdowns at the top of the page, or search for specific events using the search bar. Click any event row to open the event detail panel with context for that inference call.
AI Explorer
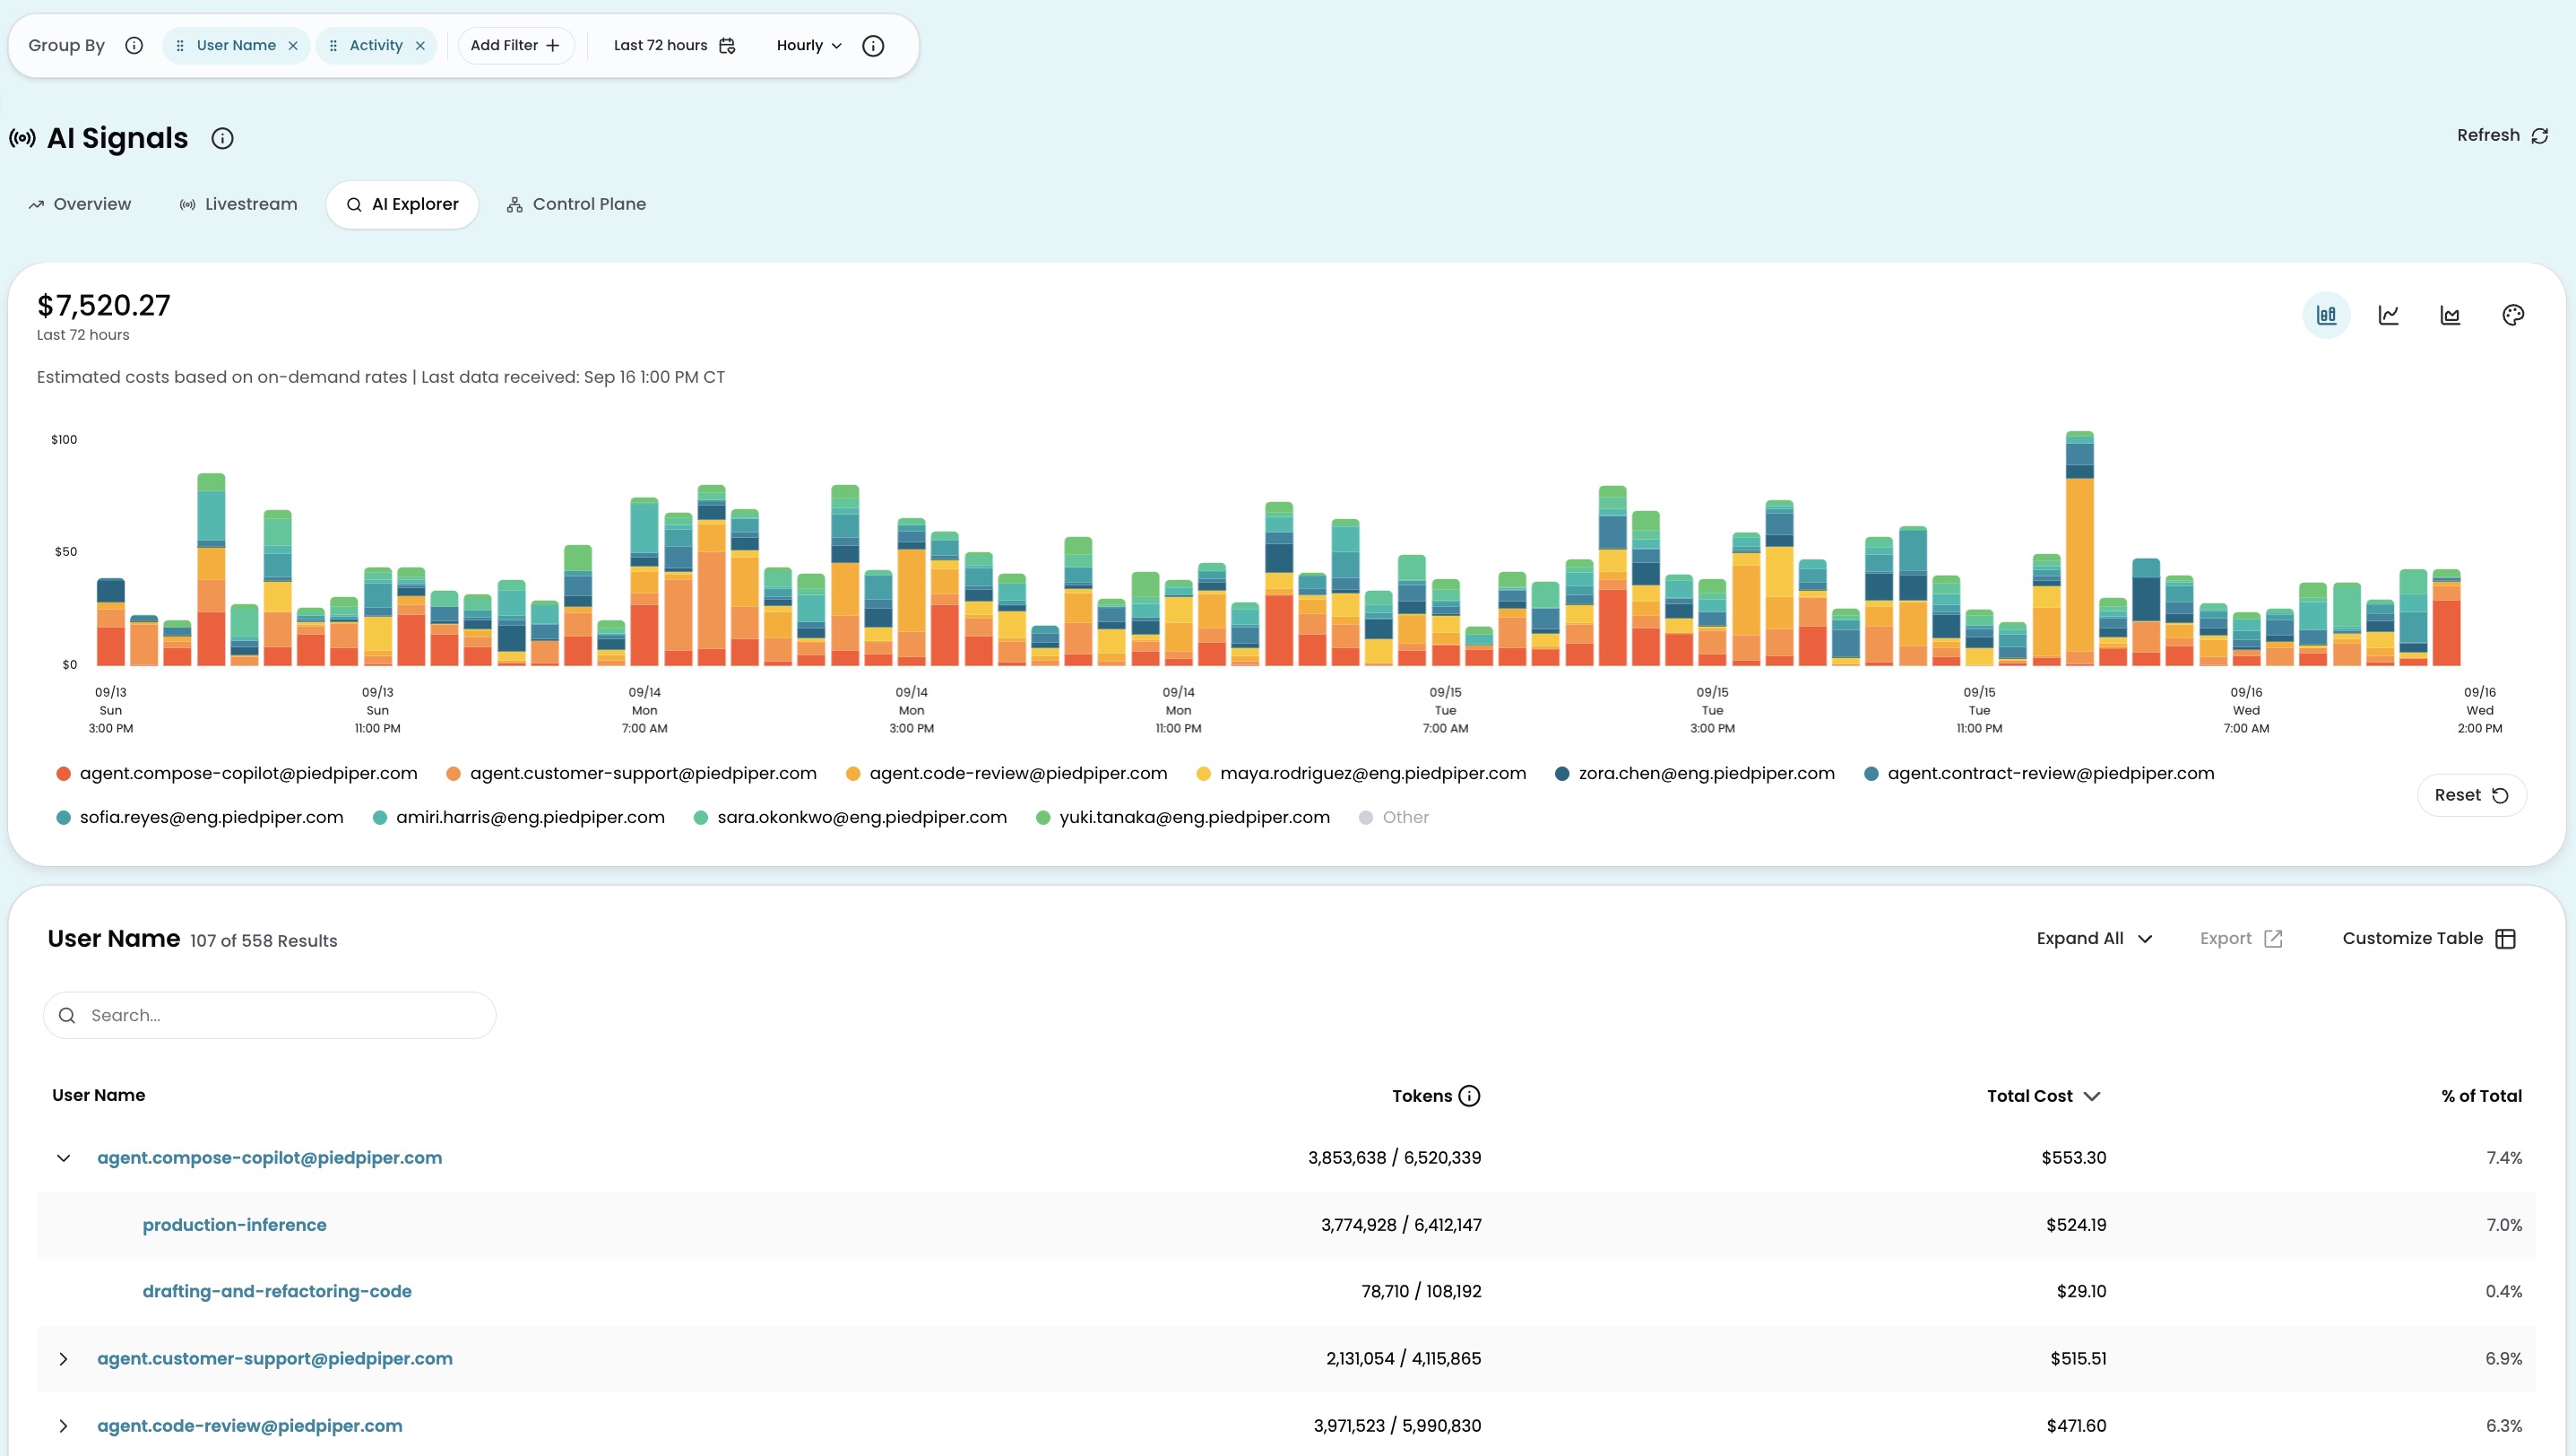
AI Explorer aggregates estimated AI spend into a grouped view. Group spend by two dimensions at once and select a time range to analyze estimated spend patterns across your organization.
The table shows total spend, tokens, and percentage of total cost by default. Cache and models columns are available through the Customize Table panel.
Costs in AI Explorer are estimates based on token volume at published market rates. Reconciled costs from your provider billing are available across the platform.
Putting it together
The tabs in AI Signals are designed to work together. Overview gives you the high-level picture; when you spot something worth investigating, the spend breakdown and cross-filters lead naturally into AI Explorer for deeper analysis. If a cost spike triggered an alert, the Anomalies panel on Overview links directly to the associated incident.
When you validate a new integration, use Livestream to confirm events are arriving with the expected context.
Available integrations
Connect your AI platforms to start sending data to AI Signals:
| Integration | How it works |
|---|---|
| macOS Collector | Captures AI usage from macOS devices through a network extension |
| LiteLLM | Streams AI usage from your LiteLLM gateway |
| Bifrost | Streams AI usage from your Bifrost gateway |
| OpenTelemetry | Ingests AI usage via OpenTelemetry-compatible instrumentation |
| Claude Code | Captures usage from Anthropic's Claude Code CLI |
For provider-level billing connections (Anthropic, OpenAI, Cursor), see AI Platforms.
Have questions or feedback? Reach out to your account manager.
Updated 9 days ago