Navigating CloudZero
CloudZero is designed to get you to the answers you need quickly. This page walks you through the interface so you feel confident from your first login.
Find any tool in the left sidebar
Everything you need is in the left sidebar. The top section gives you direct access to the tools you use every day:
| What you can do | |
|---|---|
| Explorer | See all your costs in one place, drill down to any resource. |
| Optimize | Find specific ways to reduce your cloud spend. |
| Anomalies | See when costs changed unexpectedly. |
| Analytics | Build and view Dashboards for reporting. |
| Dimension Studio | Organize costs by team, product, or any category visually. |
| Budgets | Set spending limits and get alerts when you approach them. |
| Notifications | View your cost anomaly alerts, weekly trends, and other notifications. |
| Settings | Manage connections, users, integrations, and organization settings. |
Select ‹ on the sidebar edge to collapse it to icons only, or click the split square icon at the top to hide it completely.
Read the cost graph and table
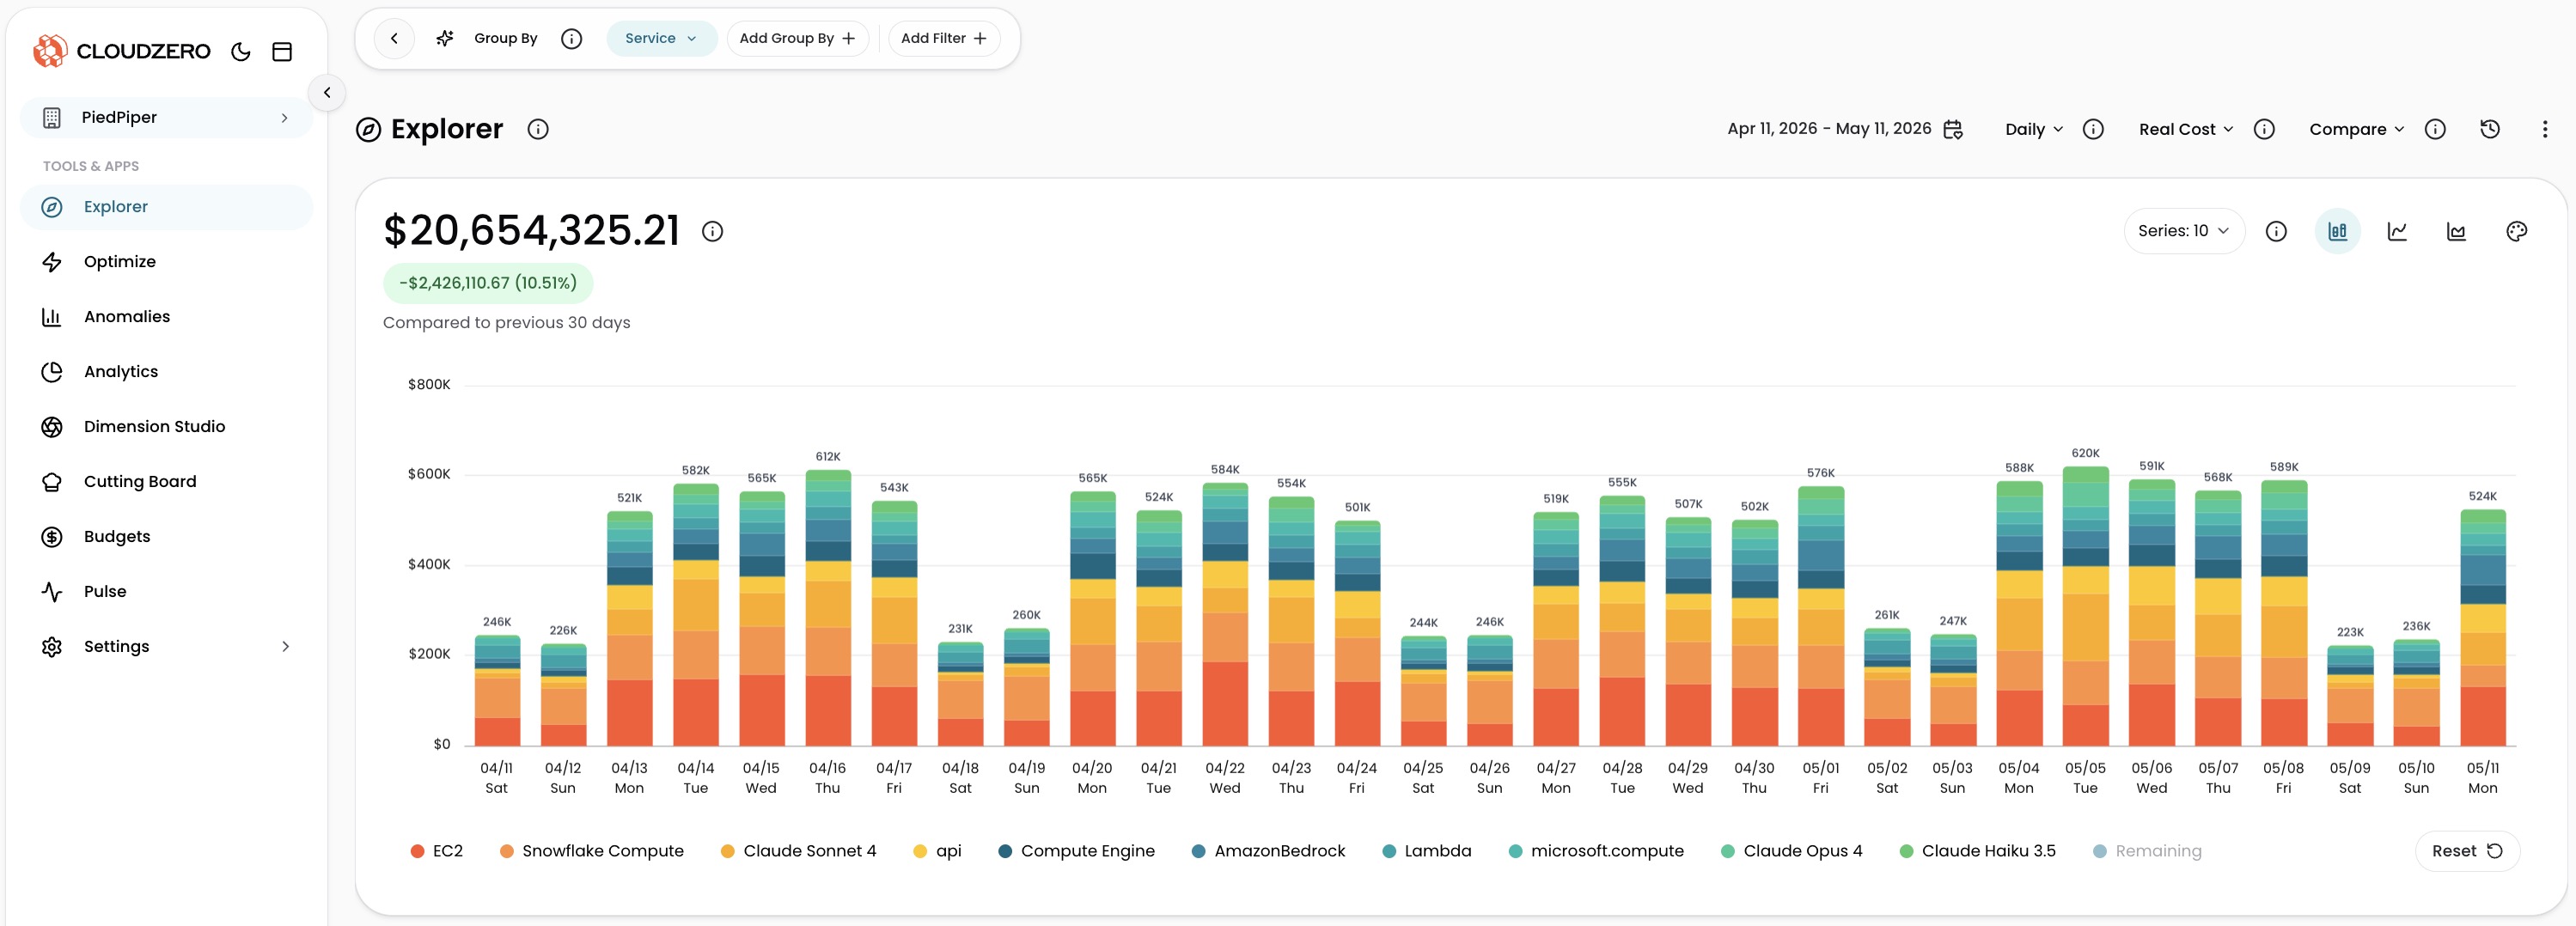
When you open Explorer, the first thing you see is the cost graph. It gives you an immediate answer to "what am I spending and is it changing?"
- Total Cost at the top shows your spend for the selected period
- Cost of Change (green or red) shows whether spend went up or down compared to the previous period
- The stacked bar chart breaks down costs by the selected Dimension. Each color represents a group, identified in the legend below the graph.
Below the graph, the Results table ranks your spend with Total Cost, Cost of Change, and % of Change columns. Click any row to drill deeper into that category.
For details on interacting with the graph (clicking bars, legend items, zooming), see Graph interactions.
Change what you see with the toolbar
The toolbar at the top of Explorer is where you shape your query:
| Control | What it does |
|---|---|
| Group By | Choose how to break down your costs (by team, service, account, or any Dimension). |
| Add Group By + | Add a second category for a nested breakdown. |
| Add Filter + | Focus on a specific subset (one team, one service, one region). |
| Time Range | Choose the period to analyze (last 7 days, last 30 days, custom dates). |
| Granularity | Set how detailed the graph is (Daily, Hourly, Weekly, Monthly). |
| Cost Type | Switch between different ways to measure the same spend (Real Cost, Amortized, Billed). Learn more. |
| Additional Features ( ⋮ ) | Access Views, Anomalies and Events, and Create Insight. |
For a full walkthrough of each control, see Grouping, Filtering, and Time Range.
Select ‹ on the left side of the toolbar to collapse it (an orange Filters button appears to re-expand). When filters are active, click the up arrow near Clear All to tuck the filter bar away without losing your filters.
Get help without leaving CloudZero
Click the Guide (orange Map Icon) in the bottom-right corner of any page to open the in-app guide:
- What's New: latest features and improvements, searchable
- Shortcuts: keyboard shortcuts
- Glossary: definitions of CloudZero terms
- Help: links to documentation and support
You can drag the Help launcher anywhere on the page so it does not block charts, tables, or actions.
The (i) icons throughout the interface are tooltips. Click any of them for a quick explanation of that control or data point.
Customize your experience
Dark mode: Click the moon icon ( ☽ ) next to the CloudZero logo to switch to dark mode. Click it again to switch back.
Share what you see: As you change Group By, filters, time range, and other settings, the URL updates automatically. Copy it and send it to a colleague; they see exactly what you see.
Manage your settings
Select Settings in the left sidebar to expand the menu, or select All Settings at the bottom to see everything on one page. Settings are organized into three groups:
In Data Collections, you manage what data flows into CloudZero:
- Cloud Connections: your cloud providers and SaaS platforms
- Telemetry Streams: send your own metrics (like transactions or users) to measure cost per unit or allocate shared resources
- Kubernetes Agents: agents in your K8s clusters
- Snowflake Data Sharing: share cost data to your Snowflake account
- Dimension Namespaces: separate Dimension definitions by team or workflow
In User Permissions, you control who can do what:
- Roles: manage user Roles
- Users: add, remove, and manage users
- Manage Multiple Organizations: manage multiple CloudZero accounts from one place
In Preferences & Extensions, you configure integrations and personal settings:
- API Keys: for the CloudZero API and integrations
- SSO Integrations: single sign-on providers
- App Integrations: Slack, Jira, and other tools
- Views: create and manage Views
- Personal Settings: display name, theme, chart colors, and email notifications
Have questions or feedback? Reach out to your account manager.
Updated about 1 month ago