

Spend Projections
Spend Projections shows your organization's AI spend over time, projects where it is headed, and surfaces the teams, models, and repositories driving changes. Use it to answer three questions: how much have you spent on AI this year, where will you end the month and the year, and is the pace going up or down.
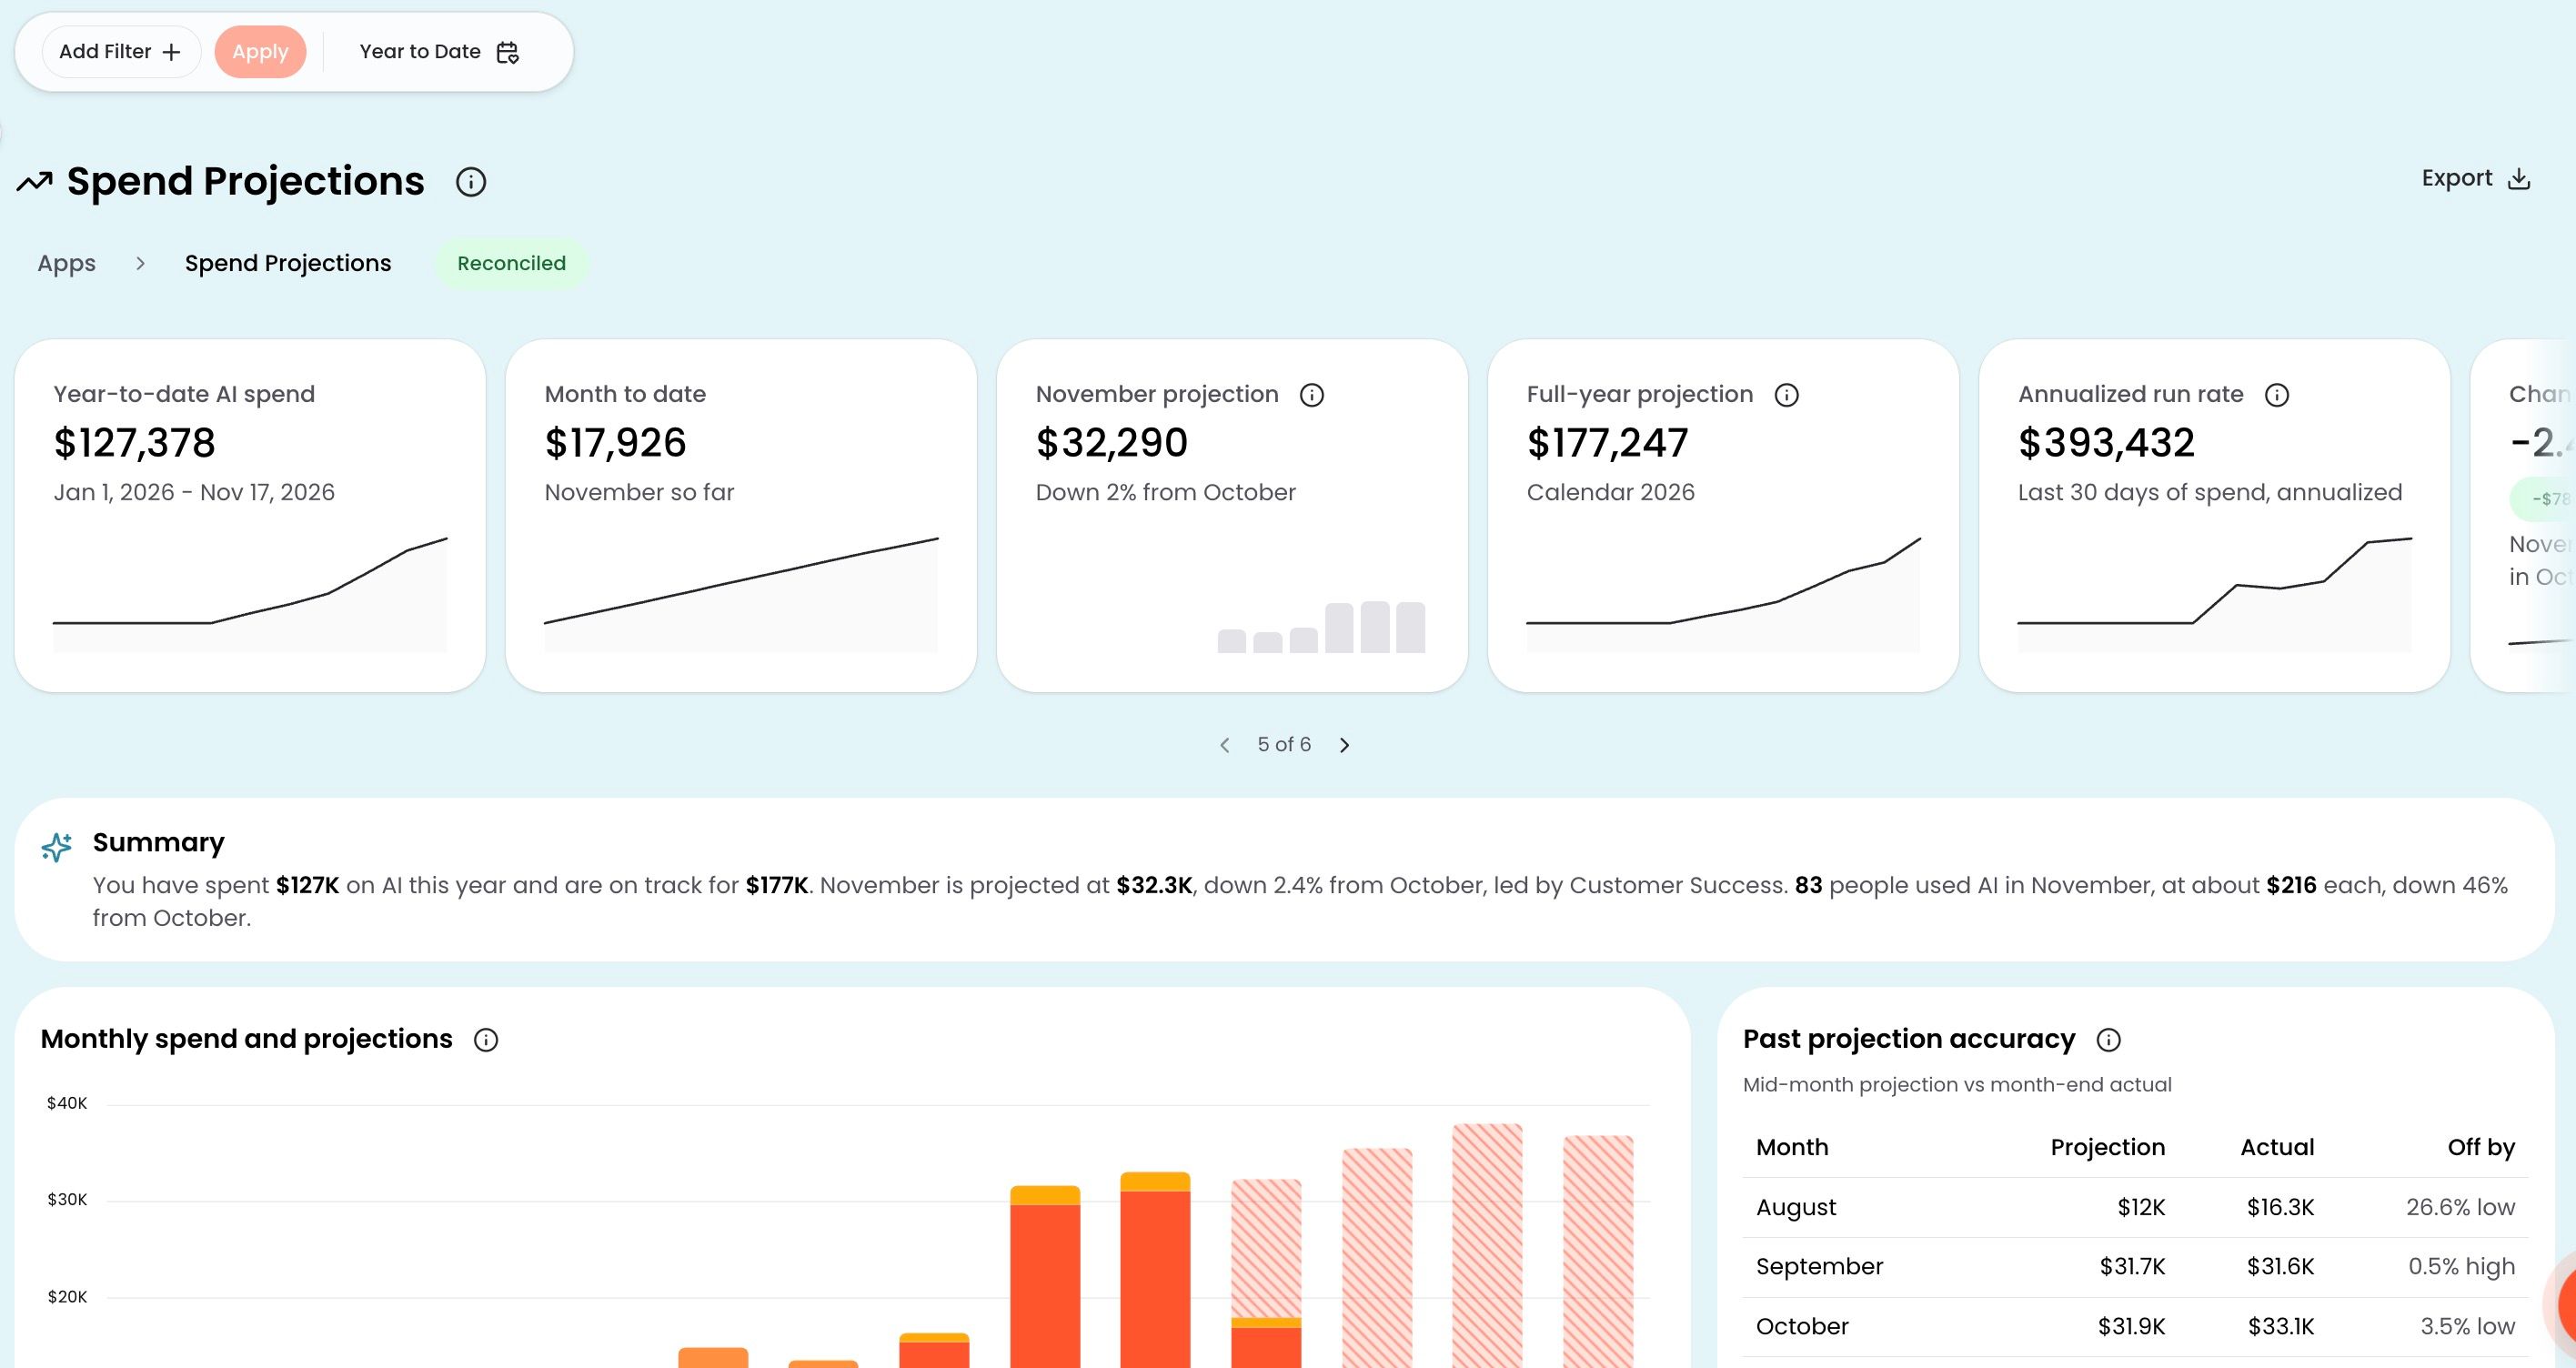
Coverage and capabilities are expanding. To get started, reach out to your account manager.
To open it, go to Apps > Finance > Spend Projections.
Filter and date range
Use Add Filter at the top of the page to narrow the view to a specific department, team, or model, then click Apply. Every card, chart, and table on the page updates to reflect the filter.
The date range defaults to Year to Date. Change it to focus on a different period.
KPI cards
Six cards summarize your AI spend at a glance:
| Card | What it shows |
|---|---|
| Year-to-date AI spend | Total spend from January 1 through today |
| Month to date | Spend so far this month |
| Monthly projection | Projected total for the current month, based on actual spend so far plus a remainder derived from your last 28+ days of daily billing data, adjusted for day-of-week patterns, compared against the previous month's reconciled total |
| Full-year projection | Projected total for the calendar year: closed months use reconciled billing data, the current month uses its projection, and remaining months are projected individually using the same pattern analysis |
| Annualized run rate | Your average daily AI spend over the last 30 days, multiplied by 365 |
| Change vs. last month | Whether this month is above or below last month, in both percentage and dollar terms |
Click the info icon on any card for details on how the value is calculated.
Below the cards, the Summary puts the key numbers in a single sentence. Copy it into a report or a message to leadership.
Charts and projections
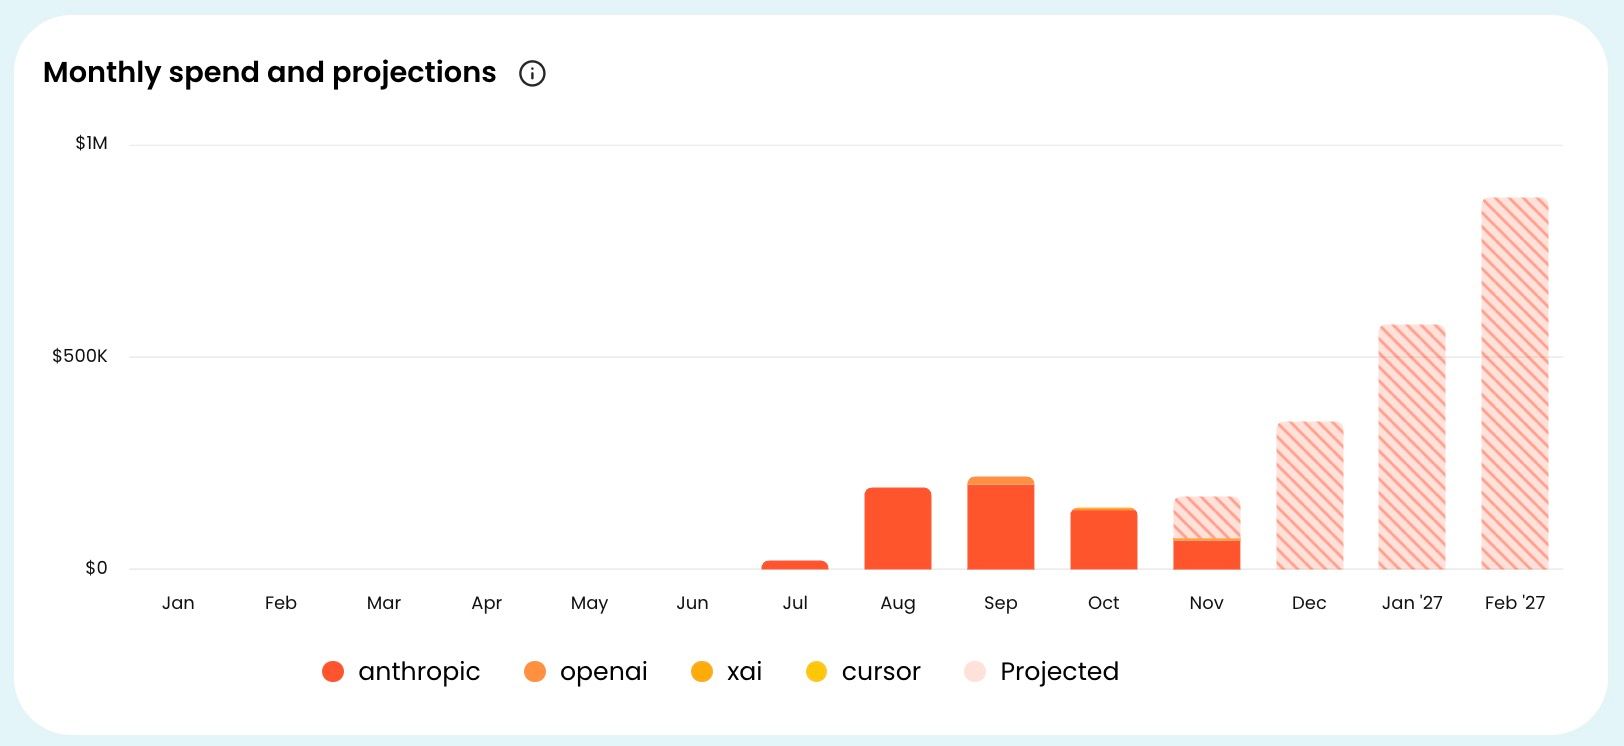
The Monthly spend and projections chart shows actual spend (solid bars) and projected spend (striped bars) by model author. Hover the info icon next to the chart title for methodology details. CloudZero uses at least 28 days of daily spend data, adjusts for day-of-week patterns, and weights the most recent 14 days more heavily when it detects a significant shift.
Past projection accuracy, next to the monthly chart, compares each past month's mid-month projection with the actual total. Use it to calibrate how much confidence to put behind the current projection.
Cumulative spend shows a running total as a line chart. The solid line is actual spend; the dashed line is the projection to the end of the range.
Spend breakdowns
Below the charts, several panels break spend down by different dimensions:
- Top movers by department compares this month's spend so far with the same days last month. Start here when someone asks why the AI bill went up.
- Top repositories ranks code projects by year-to-date AI spend, with this month's total and the change from last month.
- Share of spend by model author shows the provider split for the current month. Use the tabs to switch to Cloud Platform or Client App.
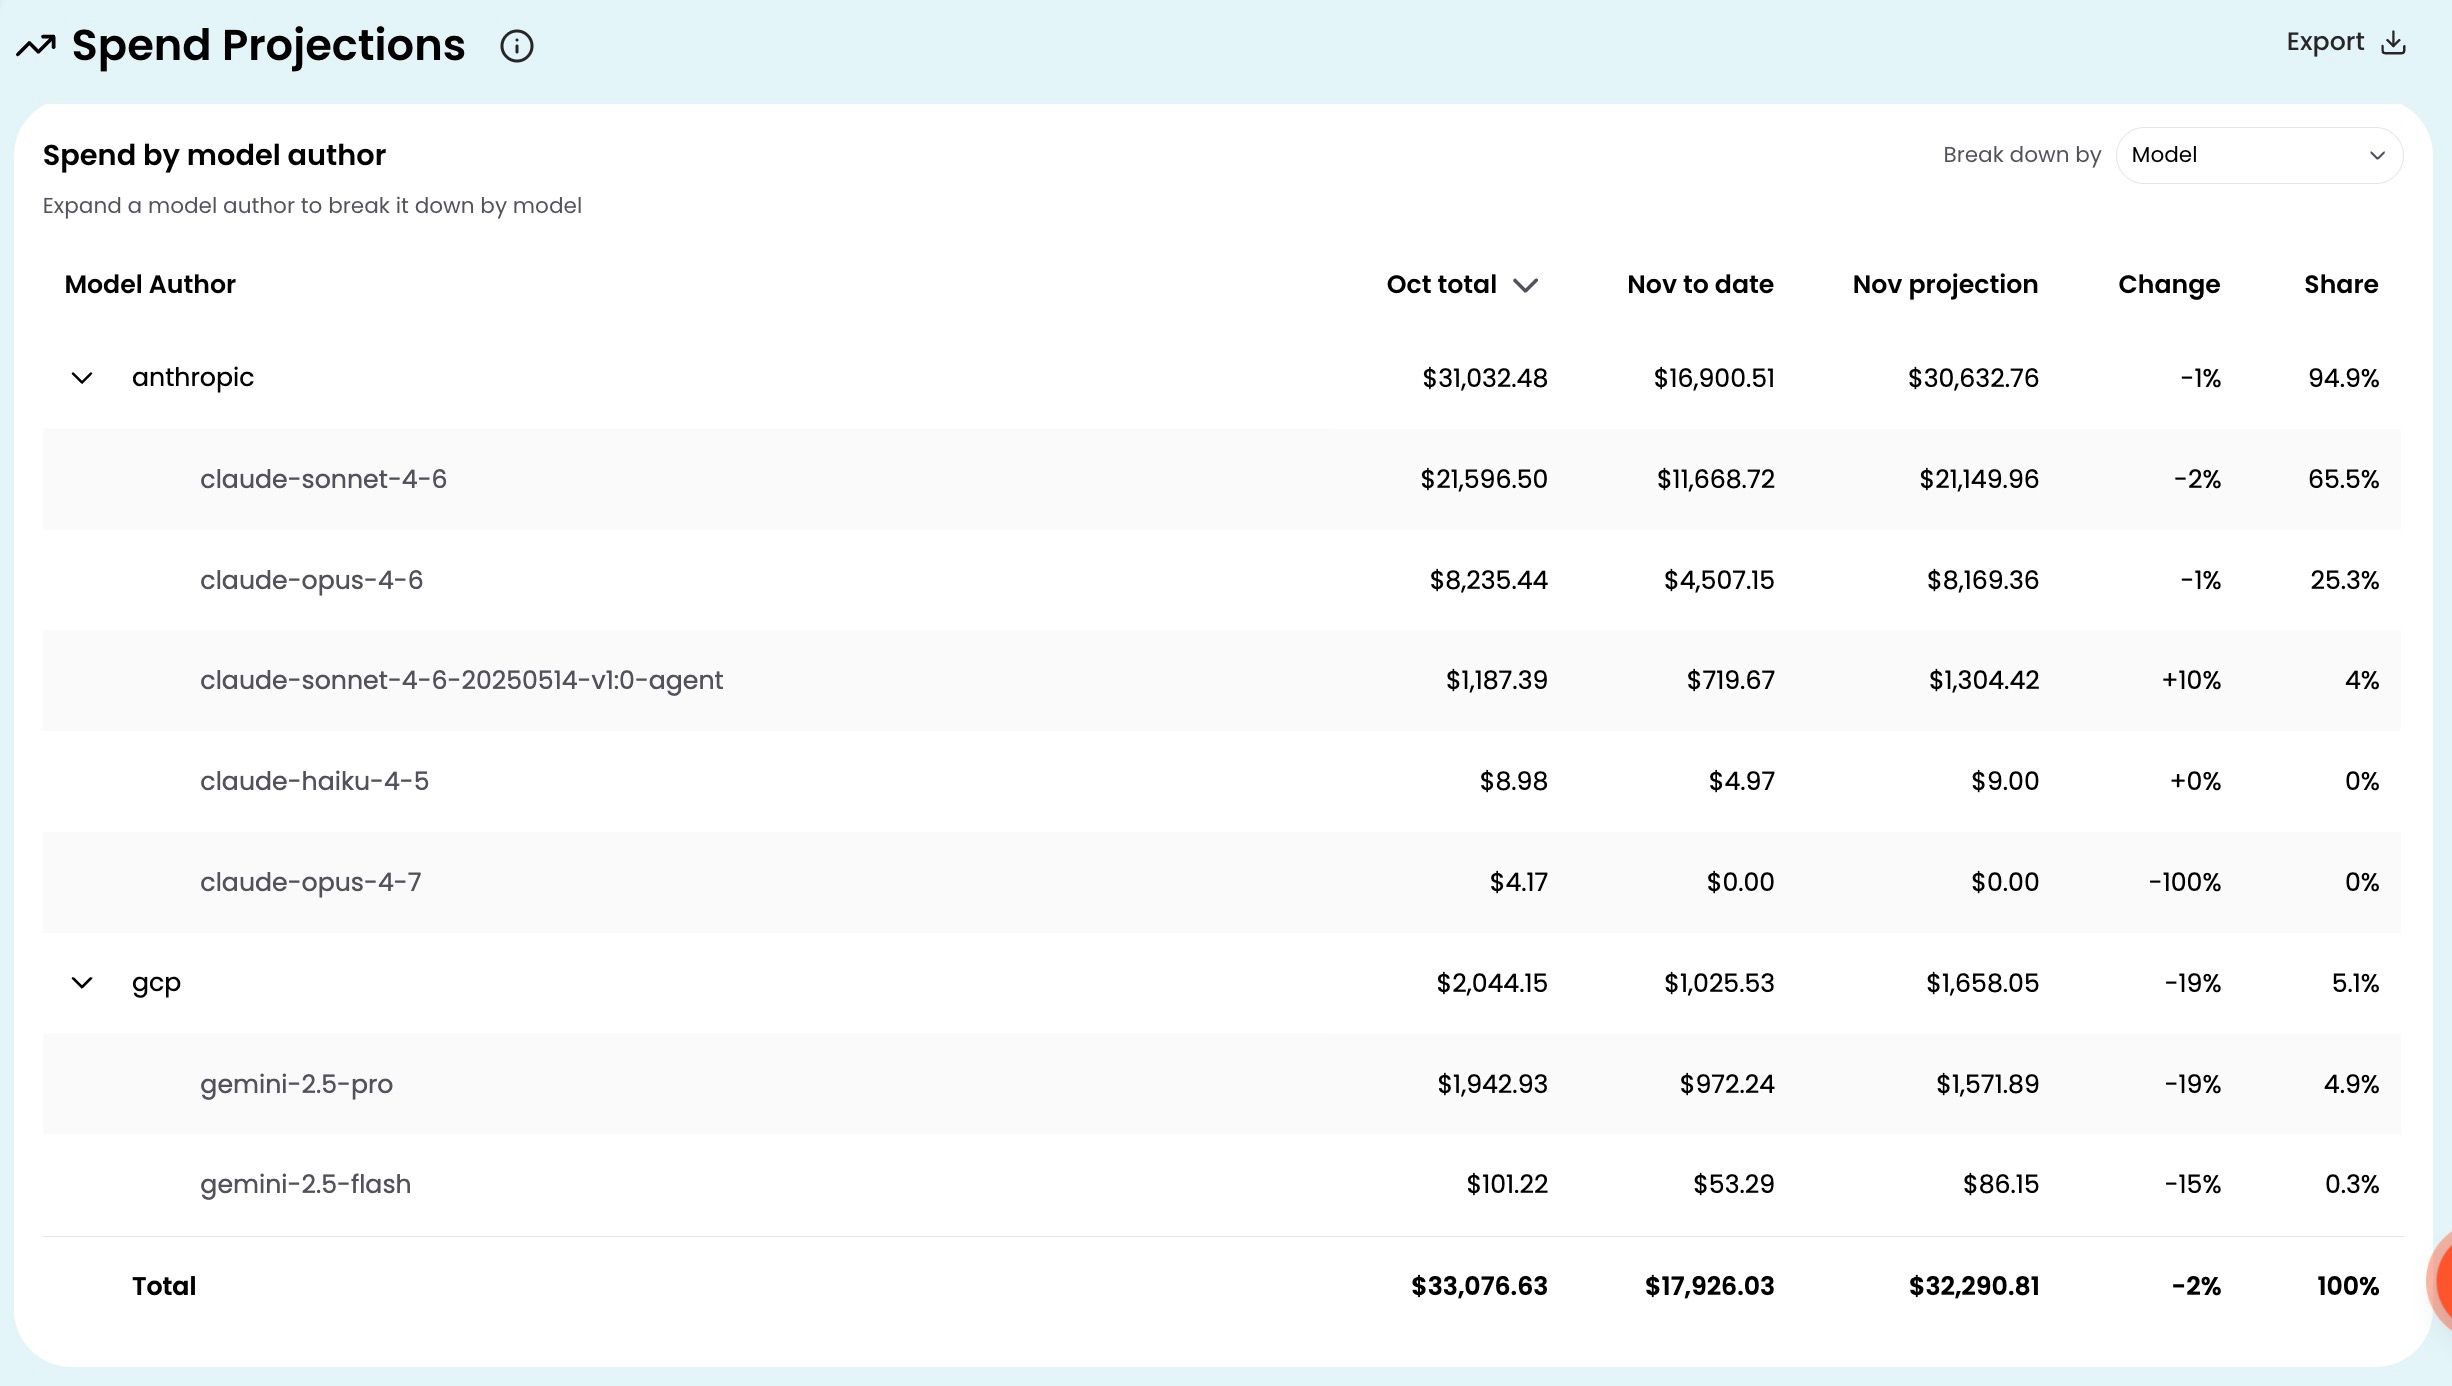
The Spend by model author table at the bottom shows totals, projections, and share of spend per provider. Click the expand arrow on any row to see individual models. Use Break down by to change the grouping to Model, Department, Activity, Repository, Client App, or Cloud Platform.
Export
Click Export at the top right to download the current view as a CSV.
Have questions or feedback? Reach out to your account manager.
Updated about 23 hours ago