

Monitors
Monitors let you set up cost anomaly detection across your cloud and AI spend, scoped to the accounts, services, users, or other cost categories you care about. When a Monitor detects a significant, unexpected change in spend, CloudZero opens an Incident so your team knows exactly what happened and can investigate.
The Monitors feature is in public preview. To turn it on, open Labs from your profile menu and enable Monitors for yourself or, if you are an admin, for your whole organization. It's the updated and improved version of Anomaly Detection: you choose the spend to watch and the thresholds that matter, and CloudZero opens an Incident your team can investigate and resolve. Monitors will eventually replace Anomaly Detection, and you can use both in the meantime.
In CloudZero, select Monitors from the left navigation.
How Monitors work
A Monitor watches a specific slice of your spend. CloudZero's forecasting model evaluates that spend every day and detects anomalies automatically. An optional threshold on the Monitor then filters which detected anomalies become Incidents. CloudZero opens Incidents on the Incidents tab, and you create and manage Monitors on the Monitors tab.
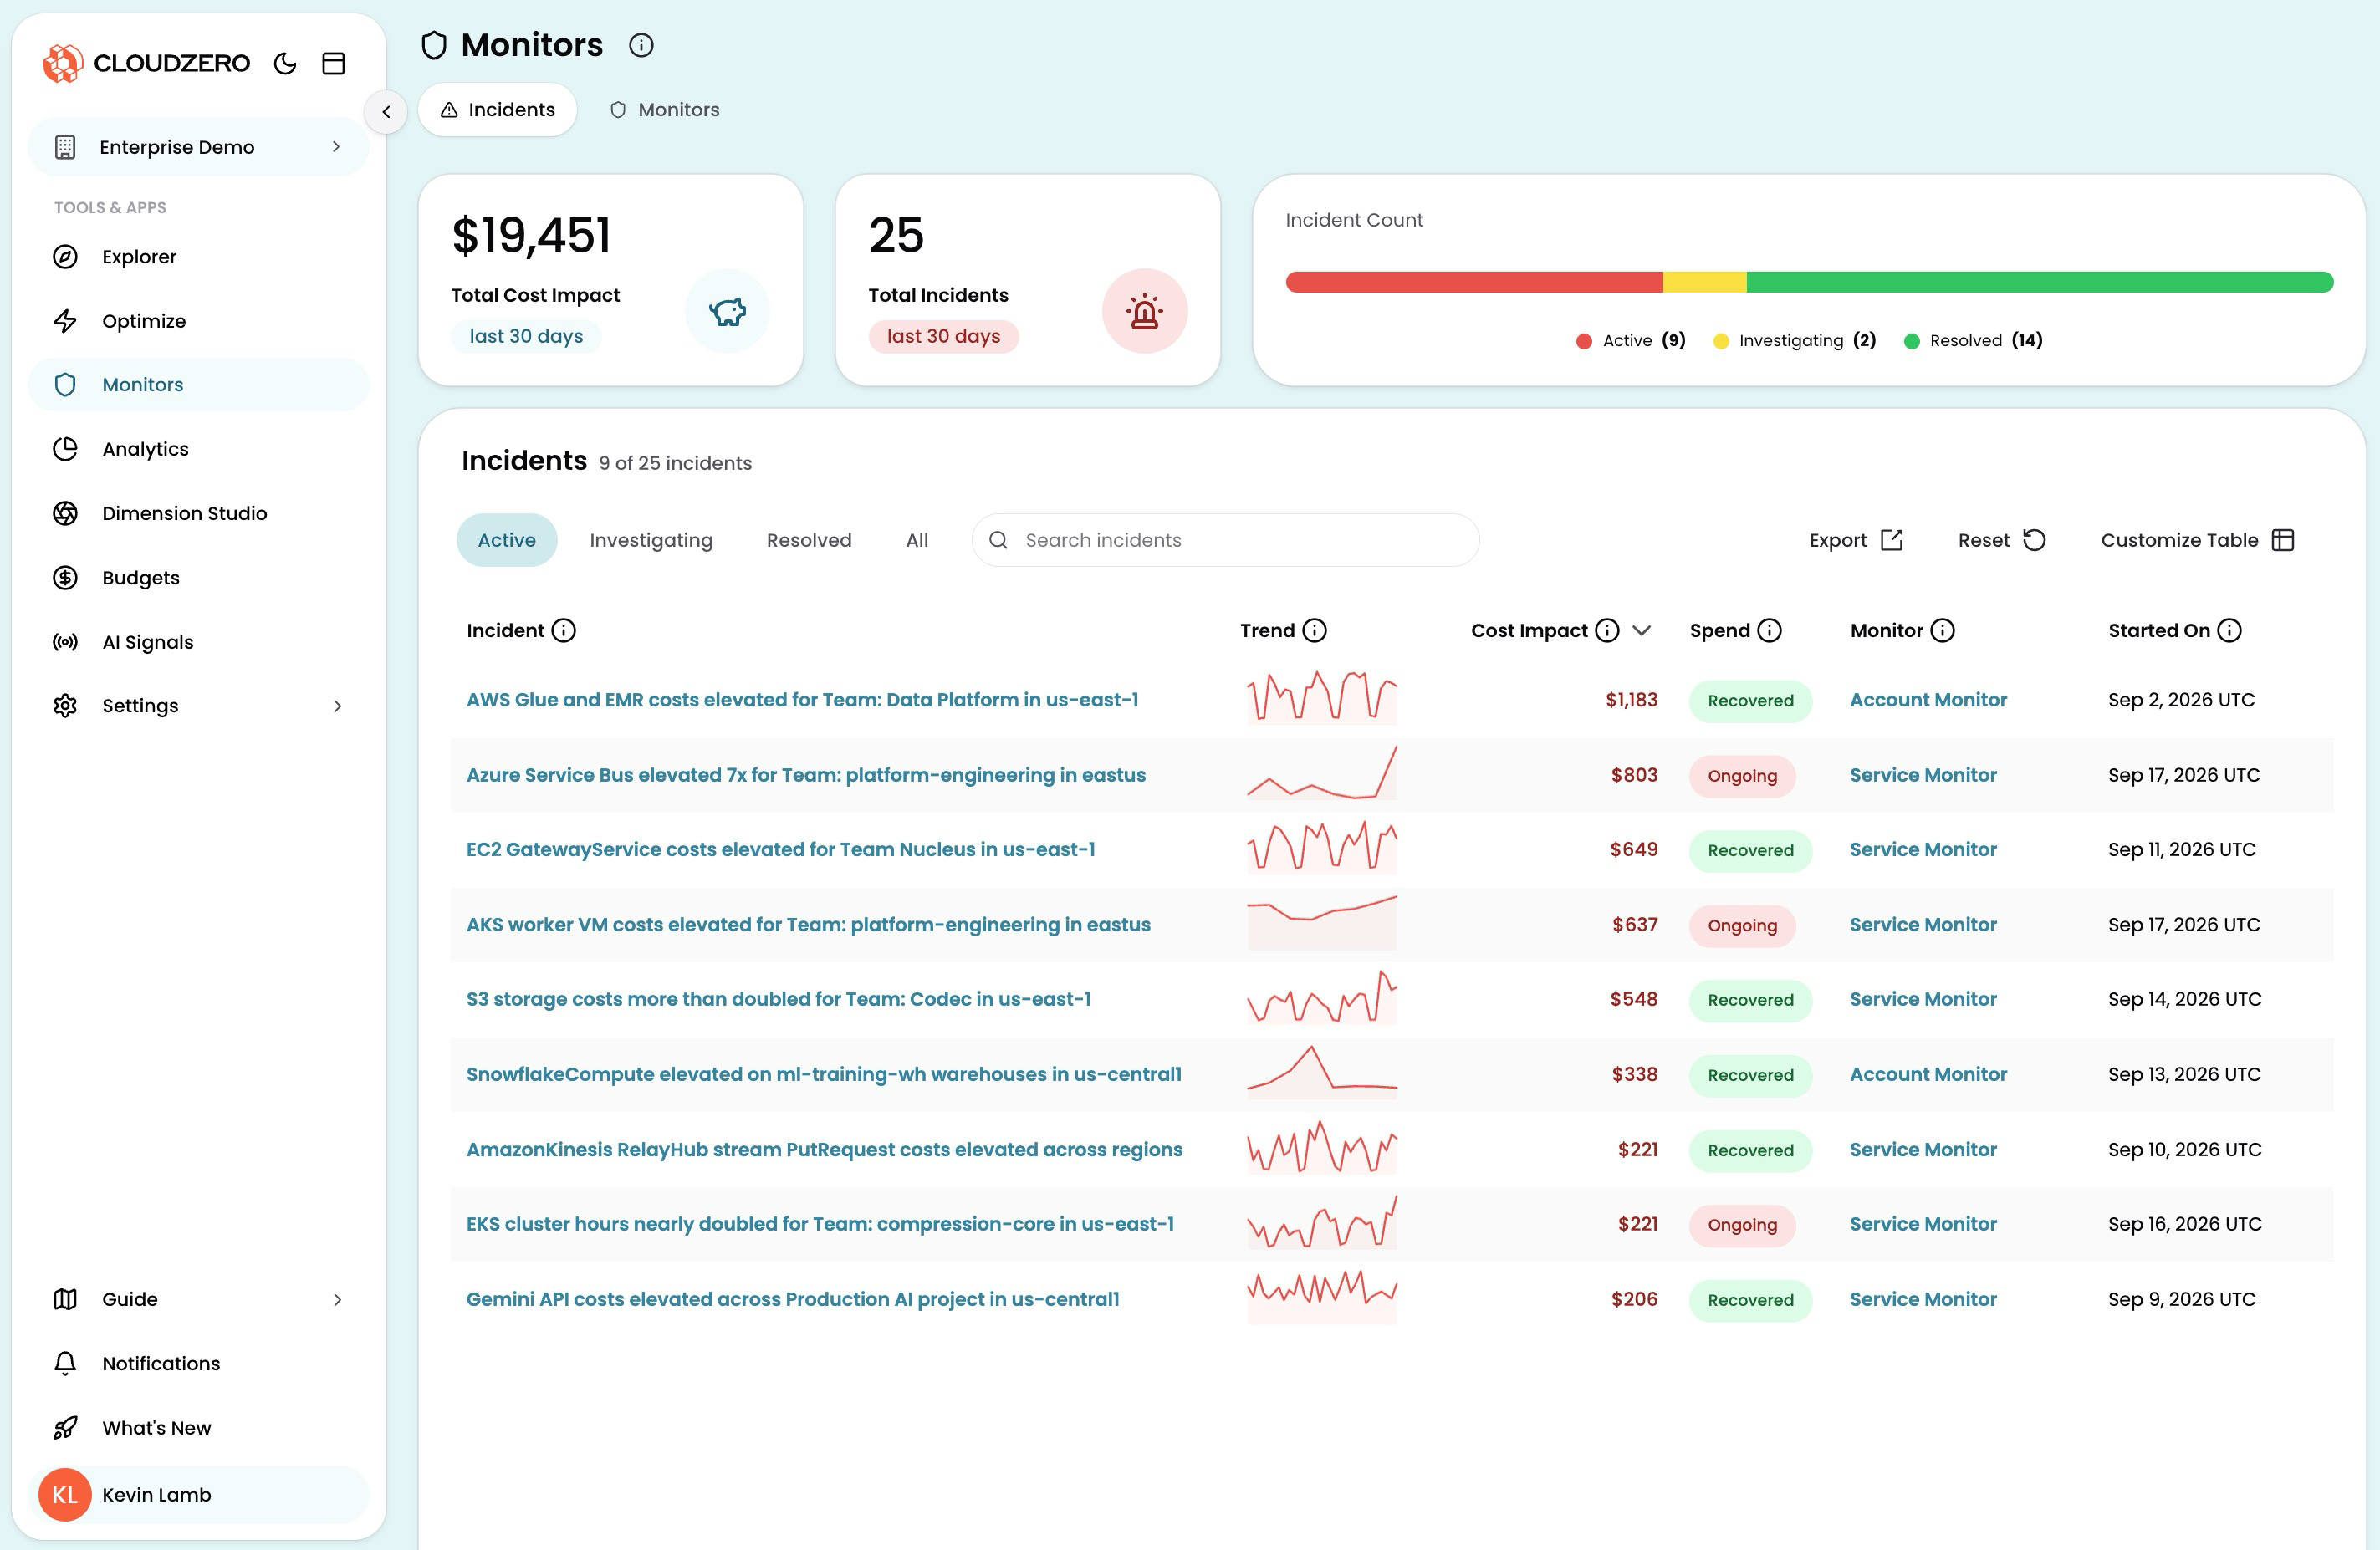
What the Incidents tab shows
The Incidents tab gives you a complete picture of all detected Incidents across your environment.
- Total Cost Impact: The combined cost impact of Incidents detected in the last 30 days
- Total Incidents: The number of Incidents detected in the last 30 days
- Incident Count: A visualization showing how many Incidents are in each status (Active, Investigating, Resolved), so you can see where your team's attention is needed
Below the summary, a results table lists all Incidents with their status, title, 30-day spend trend, cost impact, spend recovered, the Monitor that raised them, when they started, and when they were last updated.
Find an Incident
Quick filters above the table let you switch between Incident states with one click:
| Quick filter | Shows |
|---|---|
| Active | Incidents that are newly detected and not yet being investigated |
| Investigating | Incidents your team is actively investigating |
| Resolved | Incidents that have been closed, either by your team with a Resolution Reason or automatically by CloudZero |
| All | All Incidents regardless of status |
View Incident details
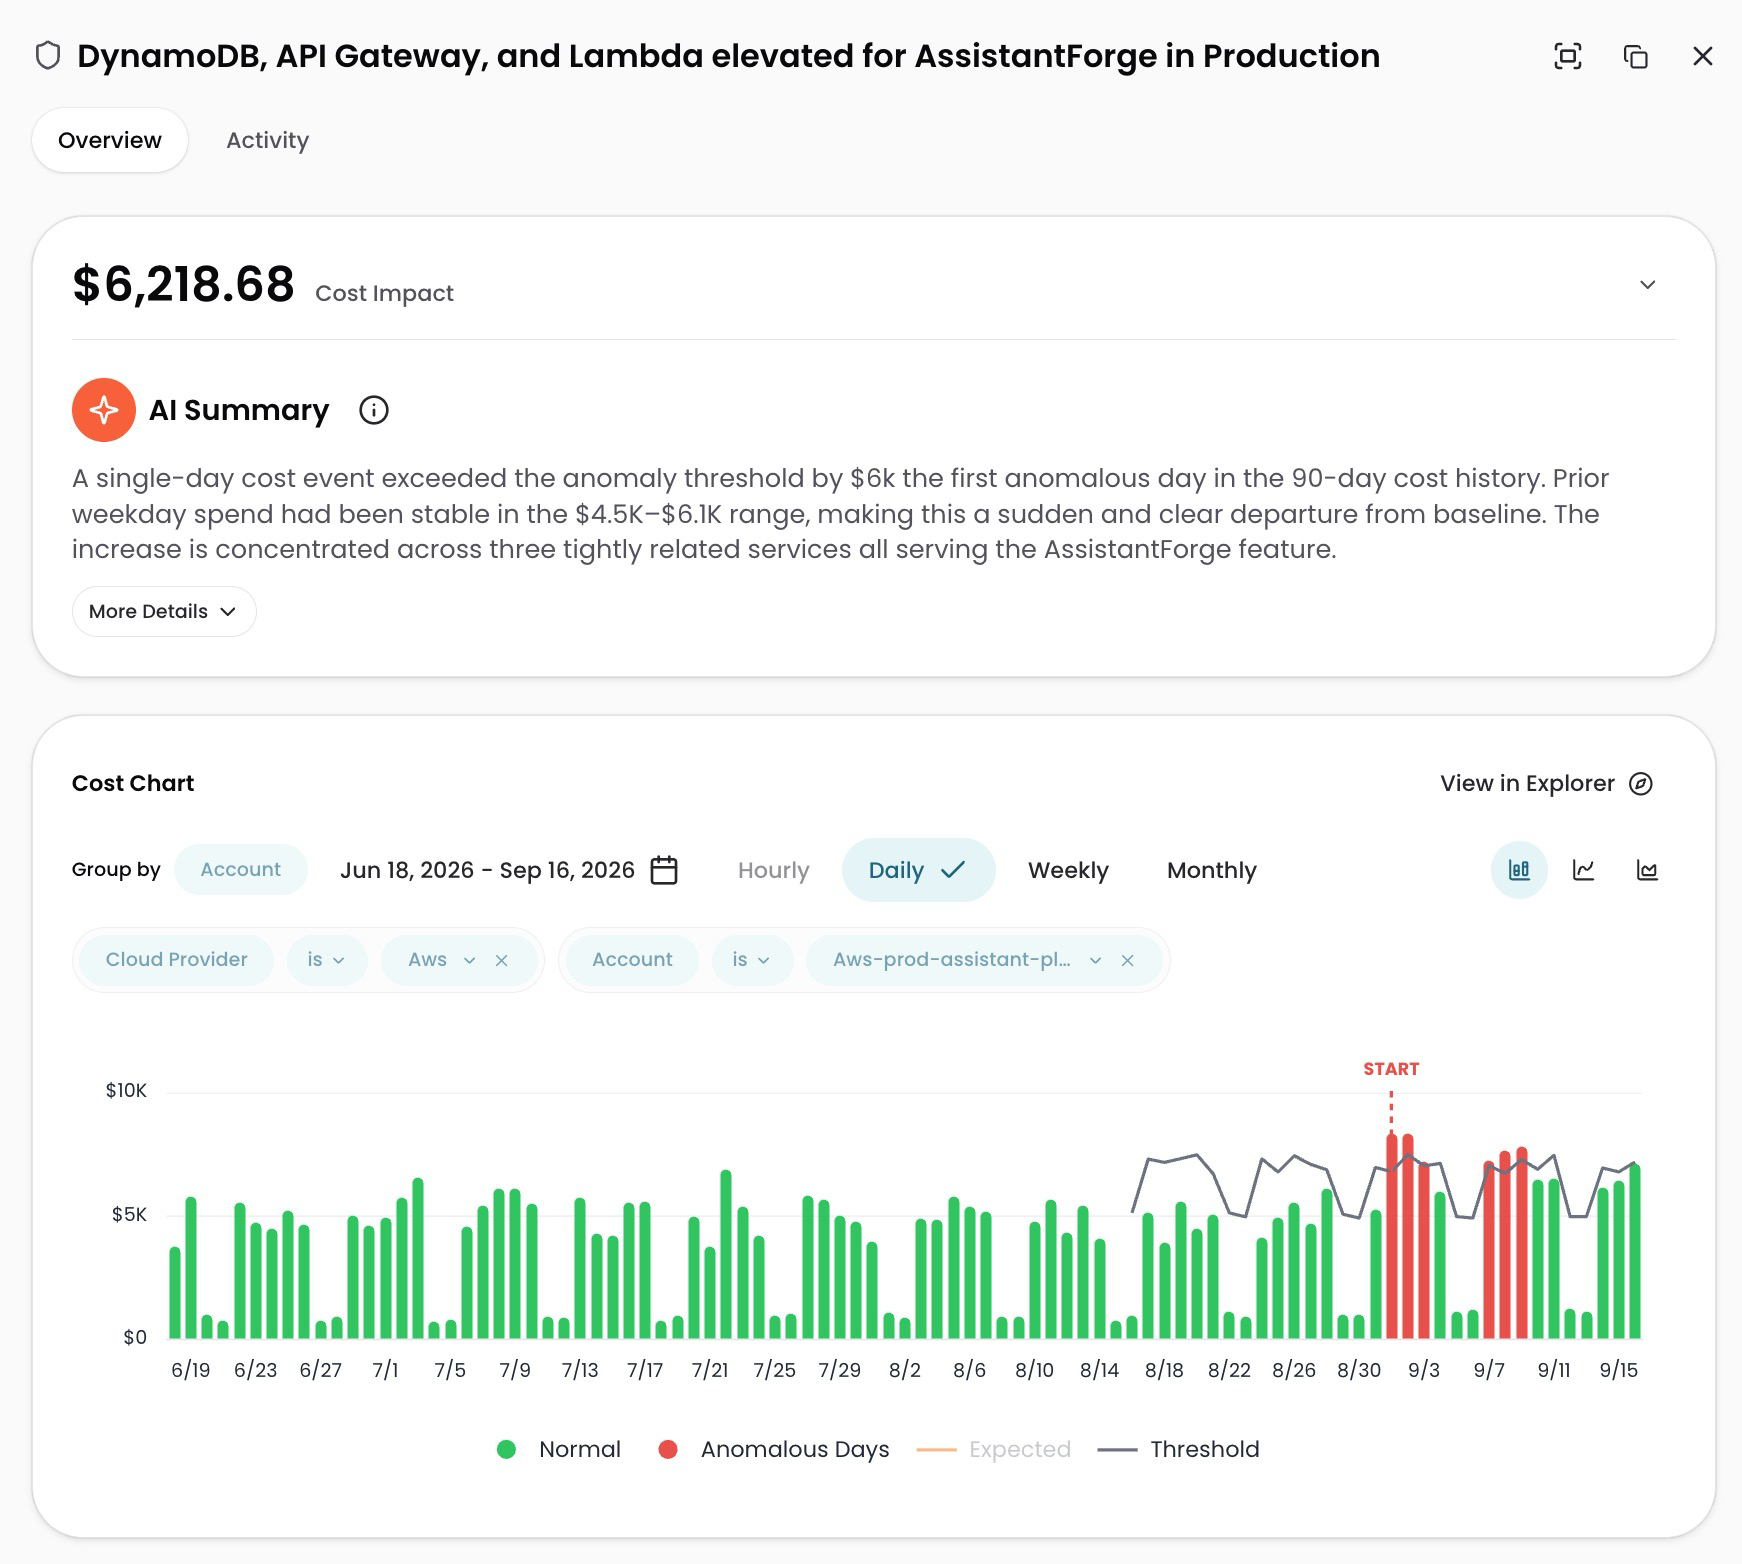
Select an Incident to open the detail flyout. The flyout gives you the full context of the Incident and lets you investigate and take action.
Overview tab
The Overview tab shows the complete picture of the Incident:
- Summary: An AI-generated description of when the anomalous spend was identified and whether it is ongoing
- Cost Impact: The difference between expected and actual spend, shown at the top of the flyout
- Cost chart: A chart showing spend around the time of the Incident, with a View in Explorer option that opens Explorer with the Incident's filters already applied
- Details: The Monitor that raised the Incident, when it started, its duration, and whether spend is ongoing
- Contributing Resources: A table of all resources involved in the Incident, showing each resource's name, service, account, region, and provider (select a resource to view it in Explorer)
Activity tab
The Activity tab shows a timeline of the Incident's lifecycle: when it was created, each time its status changed (including the Resolution Reason when it was resolved), and whether CloudZero resolved it automatically. Each entry has a timestamp. When a person changes the status, the entry also shows who made the change.
Add a comment from the Activity tab to capture context for your team, such as what you found during an investigation or why you resolved the Incident. Comments appear inline with the rest of the timeline, in the order they were posted, with the author and timestamp. You can edit or delete your own comments; you cannot edit or delete comments from other people. Commenting is allowed on resolved Incidents and does not change the Incident's status.
Manage an Incident
You can change an Incident's status from the flyout or directly from the results table.
Incident statuses
- Active: The Incident has been detected but no action has been taken.
- Investigating: Someone is actively investigating the Incident.
- Resolved: The Incident is closed, either by your team or automatically by CloudZero.
Resolve an Incident
To resolve an Incident yourself, change its status to Resolved and select a Resolution Reason:
- Intentional: The spend change was expected.
- Remediated: The underlying cause has been fixed.
- Not an Anomaly: The spend change was not actually anomalous.
You can add optional details to explain the resolution. If the Incident's spend is still ongoing, CloudZero warns you before you resolve it.
If no one resolves an Incident manually, CloudZero automatically resolves it once its spend has been back to normal for 7 days.
Track an Incident in Jira
If you connect the Jira integration, you can create a linked Jira Work Item directly from an Incident's details flyout instead of recreating the context by hand. Select Create Work Item in the flyout footer. CloudZero pre-fills the title with the Incident's title and the description with its cost impact and AI-generated summary. You can edit both before creating the Work Item. Creating or unlinking a Work Item requires Monitors write permission.
Once linked, the flyout footer shows the Work Item's key, status, and a link to open it in Jira. The Incident and the Work Item stay in sync in both directions. When the Incident's status changes in CloudZero, including when CloudZero resolves it automatically, the Work Item moves to the matching Jira status:
| Incident status | Work Item status in Jira |
|---|---|
| Active | Not started |
| Investigating | In progress |
| Resolved | Resolved |
When the Work Item's status changes in Jira, CloudZero updates the Incident:
| Work Item status in Jira | Incident status |
|---|---|
| Not started | Active |
| In progress | Investigating |
| Resolved | Resolved, with the Remediated Resolution Reason |
| Ignored | Resolved, with the Not an Anomaly Resolution Reason |
Your Jira integration's status mapping controls which of your Jira statuses count as not started, in progress, resolved, or ignored, so the exact Jira status a Work Item moves to depends on how you've mapped your Jira workflow. To change the mapping, go to Settings > App Integrations, select Settings on the Jira integration, and update the Status Mapping section.
The most recent change on either side wins, and the Activity tab records which changes came from Jira.
To remove the link, select Unlink next to the Work Item. The Work Item itself is not deleted or changed in Jira, and you can create a new one for the Incident afterward.
What the Monitors tab shows
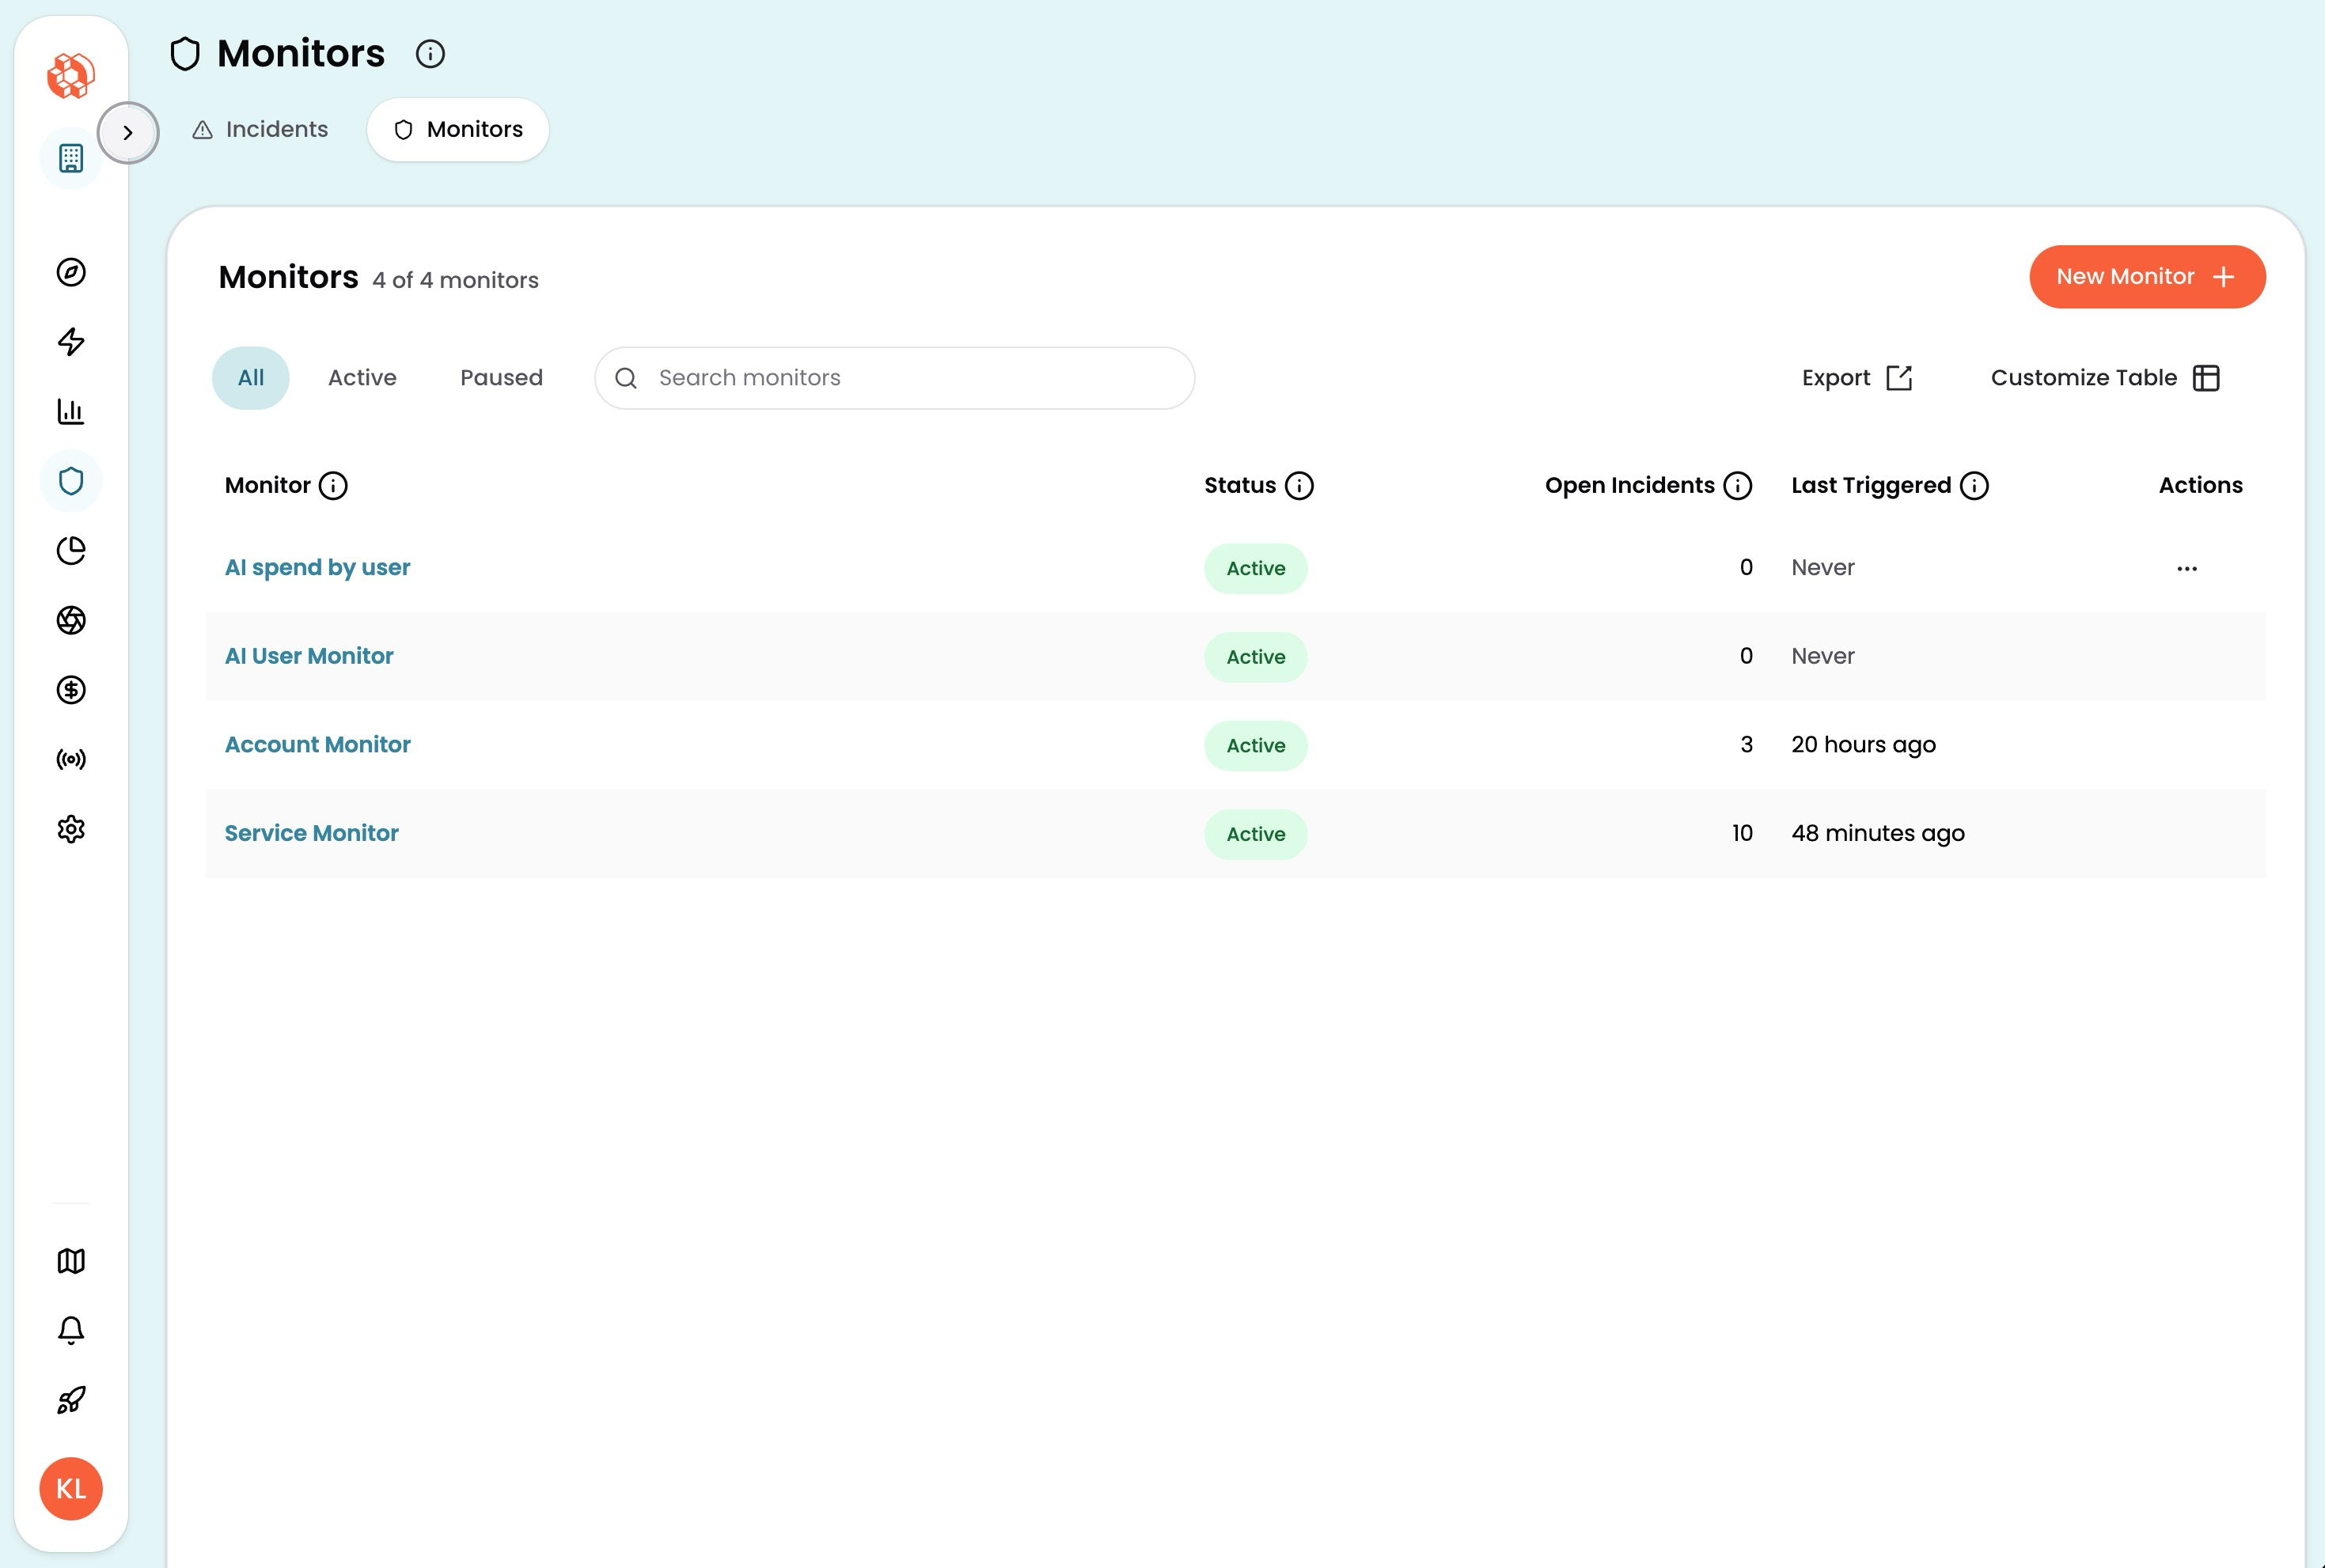
Select the Monitors tab to see and manage your Monitors. The results table shows each Monitor's name, its status (Active if it's running, Paused if it isn't), how many open Incidents it has raised, and when it last triggered. Use the All, Active, and Paused quick filters above the table to narrow the list. Select New Monitor to create a new Monitor.
Create a Monitor
-
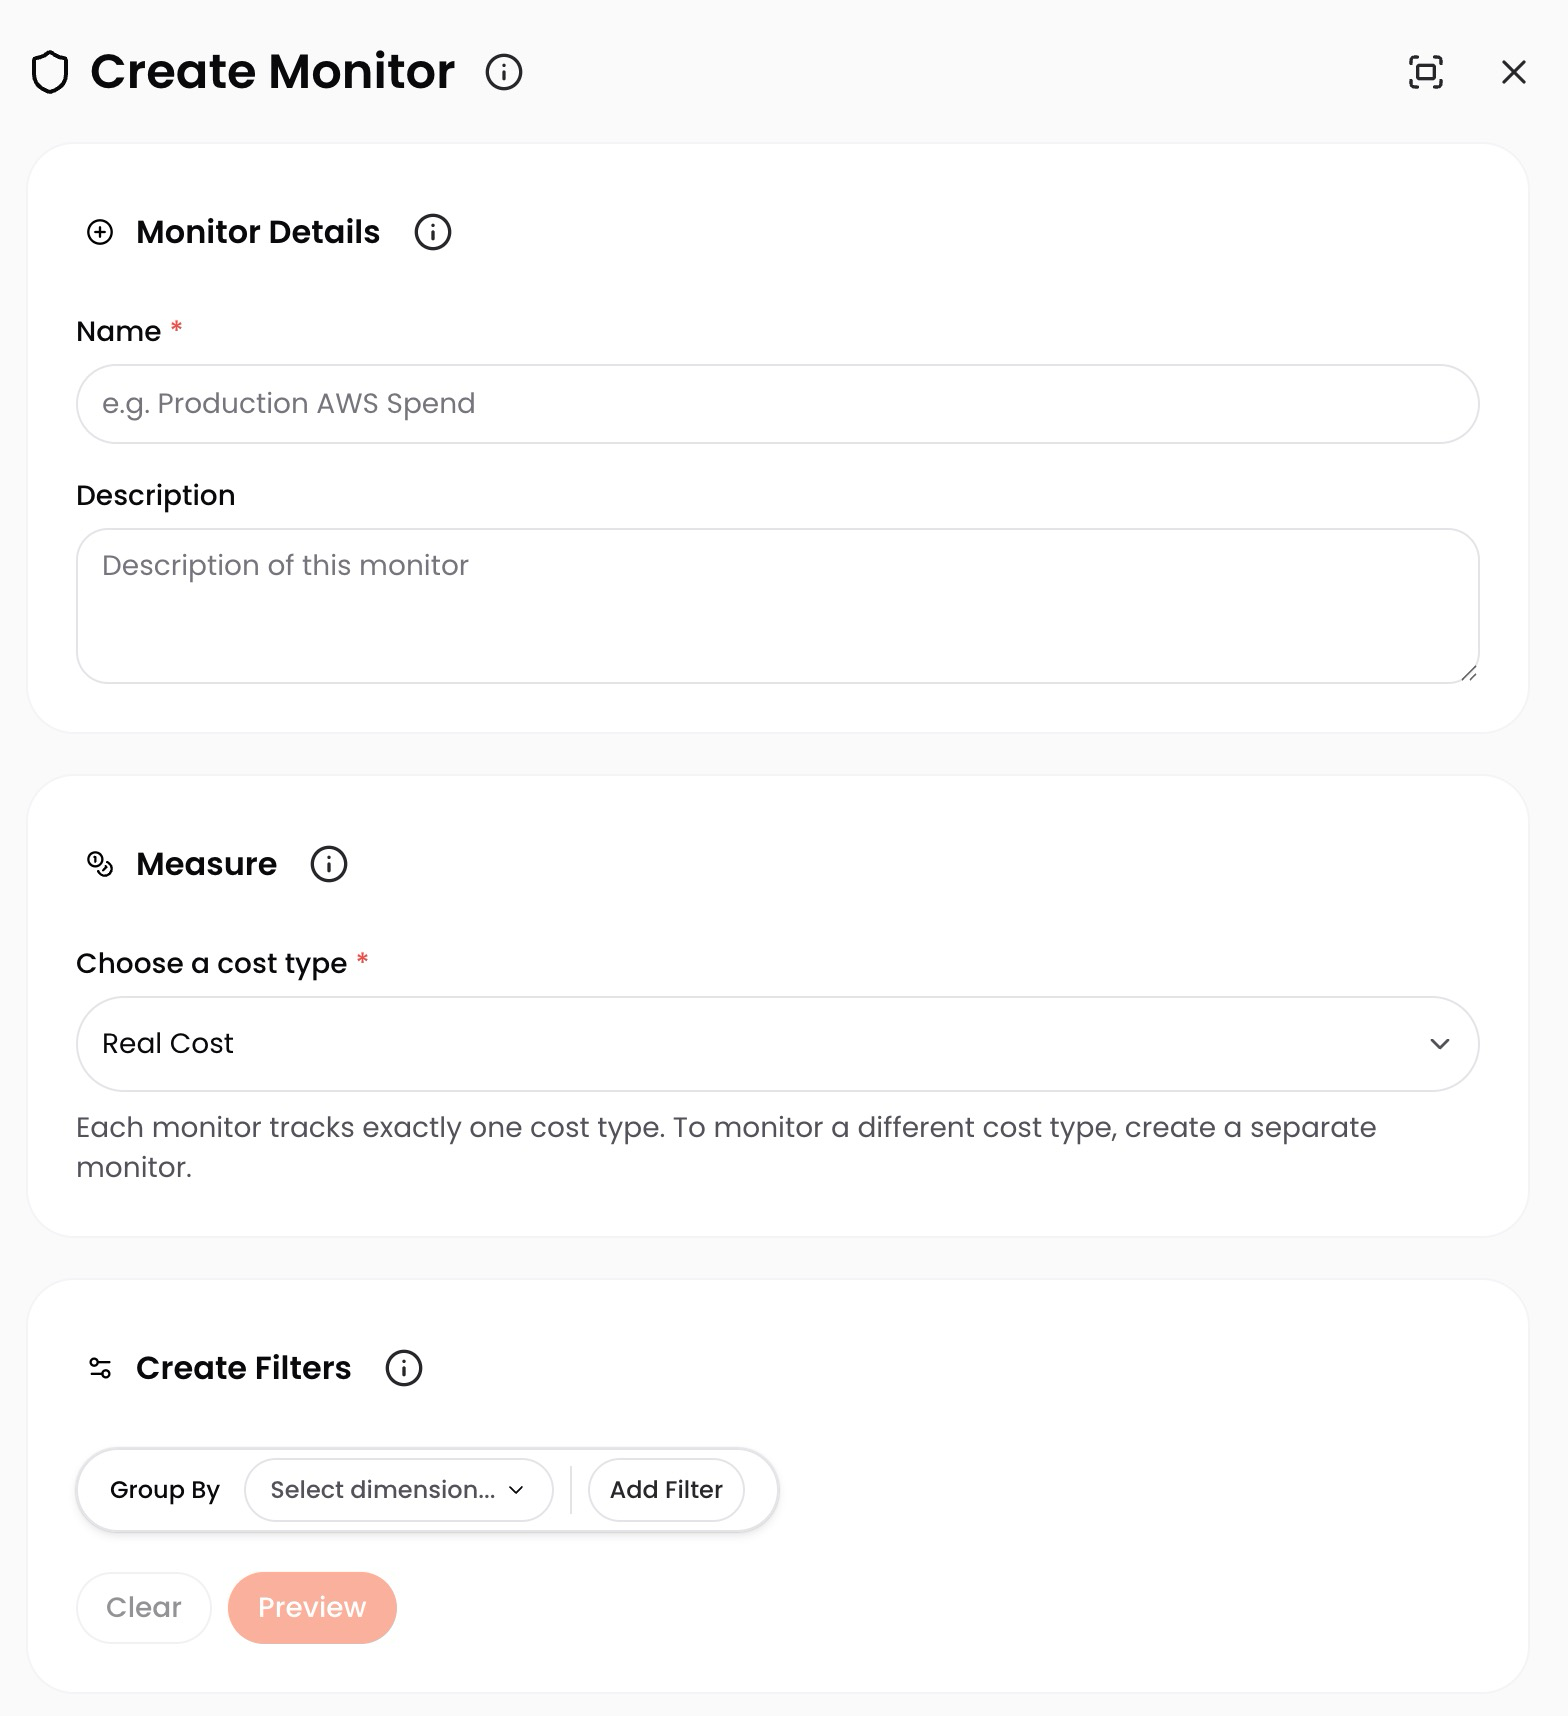
Select New Monitor.
-
Name the Monitor and, optionally, add a description.
-
Select a Cost Type: Amortized Cost, Billed Cost, Discounted Cost, Discounted Amortized Cost, Invoiced Amortized Cost, On-Demand Cost, or Real Cost. A Monitor watches one Cost Type; create a separate Monitor to track a different one. For definitions, see Cost Types.
-
(Optional) Choose a Group By Dimension, such as account, service, or user.
-
(Optional) Add filters to scope the Monitor to the spend you care about.
-
Review the cost preview to confirm the Monitor matches the spend you expect before saving.
-
(Optional) Set a threshold to filter which detected anomalies become Incidents:
- Percentage of spend: How far above CloudZero's forecast the day's spend must be, as a percentage of the forecast
- Minimum cost impact: How far above CloudZero's forecast the day's spend must be, in dollars
If you set both, the day's spend must clear both before CloudZero raises an Incident. For example, if CloudZero forecasts $1,000 for a day and you set Percentage of spend to 20% and Minimum cost impact to $500, CloudZero raises an Incident only when that day's spend reaches $1,500. If you leave both fields blank, every anomaly CloudZero's forecasting model identifies becomes an Incident.
-
Choose where CloudZero sends notifications when the Monitor opens an Incident. You can use either option or both:
| Section | What to enter |
|---|---|
| Notification Recipients | One or more email addresses, separated by commas |
| Slack Channel | One Slack Channel ID (requires the Slack integration, which also explains how to find a Channel ID) |
- Select Create Monitor.
After you save a Monitor, CloudZero evaluates its scope as soon as the next cost data ingest completes, then once a day after that.
Edit, pause, or delete a Monitor
To edit a Monitor: Select Edit from the Monitor's row, update any of its settings, and select Save Monitor.
To pause or resume a Monitor: A paused Monitor is not evaluated and generates no new Incidents. Select Pause or Resume from the Monitor's row, or from its details flyout.
To delete a Monitor: Select Delete from the Monitor's row and confirm. Deleting a Monitor also deletes its Incidents.
View Monitor activity
Every change to a Monitor is on the record, so you can answer questions like "who turned off this Monitor's alerts" without asking around. Select a Monitor to open its details flyout, with Overview and Activity tabs. The Activity tab lists every change made to the Monitor itself: when it was created, each edit (including threshold changes), every time it was paused or resumed, and every notification channel added or removed, along with who made the change and when.
This is separate from an Incident's own Activity tab, which tracks the Incident's lifecycle rather than the Monitor's configuration. See View Incident details.
System Monitors
CloudZero runs three system Monitors for you. They're already watching your spend when you turn on Monitors, so you see Incidents without building anything:
| Monitor | What it watches |
|---|---|
| Account Monitor | Spend in each account, for every cloud provider |
| Service Monitor | Spend on each service within each account |
| AI User Monitor | AI spend for each user, wherever CloudZero can identify both the user and the model provider |
System Monitors track Real Cost across all of your spend, with no filters, so every anomaly they detect becomes an Incident unless you set a threshold. When the Account Monitor and the Service Monitor both detect the same spike, CloudZero shows the Service Monitor's Incident, since it pinpoints which service changed, and hides the duplicate account-level Incident.
If you have Monitors write permission, you can adjust a System Monitor's threshold. Select Edit from the Monitor's row, then change the percentage of spend, the Minimum cost impact, or both. For example, raise the Service Monitor's Minimum cost impact to $500 so only larger service-level changes open an Incident. If notifications are enabled for your organization, the same panel also lets you add email addresses or a Slack Channel ID. Select Save Monitor to save your changes. A System Monitor's name, what it measures, and its filters and grouping stay fixed, and System Monitors can't be paused, resumed, or deleted.
Putting it together: from Incident to resolution
Set up a Monitor once, and CloudZero takes it from there. Every day, CloudZero checks the spend you scoped against what it expects to see and opens an Incident when actual costs deviate from expected trends.
From the Incidents tab, open the flyout to see the AI-generated summary, the cost chart, and the resources driving the change. Move the Incident to Investigating while your team looks into it, then resolve it with the Resolution Reason that fits: Intentional, Remediated, or Not an Anomaly.
Have questions or feedback? Reach out to your account manager.
Updated 11 days ago