

AI Data Plane
The AI Data Plane connects your AI spend to the work that caused it. It runs inside your own network, reads the inference traffic already flowing to your AI gateway, and classifies the business context associated with your AI usage. CloudZero never receives your prompt content.
The AI Data Plane is in preview. Coverage and capabilities are expanding. To get started, reach out to your account manager.
What your AI bill can't tell you
You can see what you spent on AI. What it bought is harder to see, because the work that consumed those tokens happened inside coding agents and clients your bill never names.
Three sources of AI cost data each stop short in the same place:
- Provider bills aggregate by account, key, model, and sometimes user. They do not name a team, a repository, or a ticket.
- Gateway dashboards report tokens, latency, and routing per key or virtual model. The business context is not in the request they see.
- Manual instrumentation requires owning the application that makes the call. This makes sense for AI workloads you write that power your platform; however, your heaviest AI spenders are coding agents like Claude Code and Codex.
That leaves the questions leadership asks unanswered: which product line drove this quarter's growth, what serving a given customer costs in inference, whether an agent returns what it consumes. Budgets get set on a total instead of on an owner, and an expensive workflow looks the same as a valuable one.
How the AI Data Plane works
The AI Data Plane sits on the path between your AI clients and your AI gateway. It reads each inference exchange, groups related requests into conversation turns, classifies the work behind each completed turn, and exports a prompt-free telemetry record of that turn (called a span) to CloudZero.
You choose how much of your traffic it sees. Your own router decides which inference requests reach the AI Data Plane and which go straight to your gateway, so you can start with one team or one workload and widen from there. Traffic you do not route through it stays untouched and produces no telemetry.
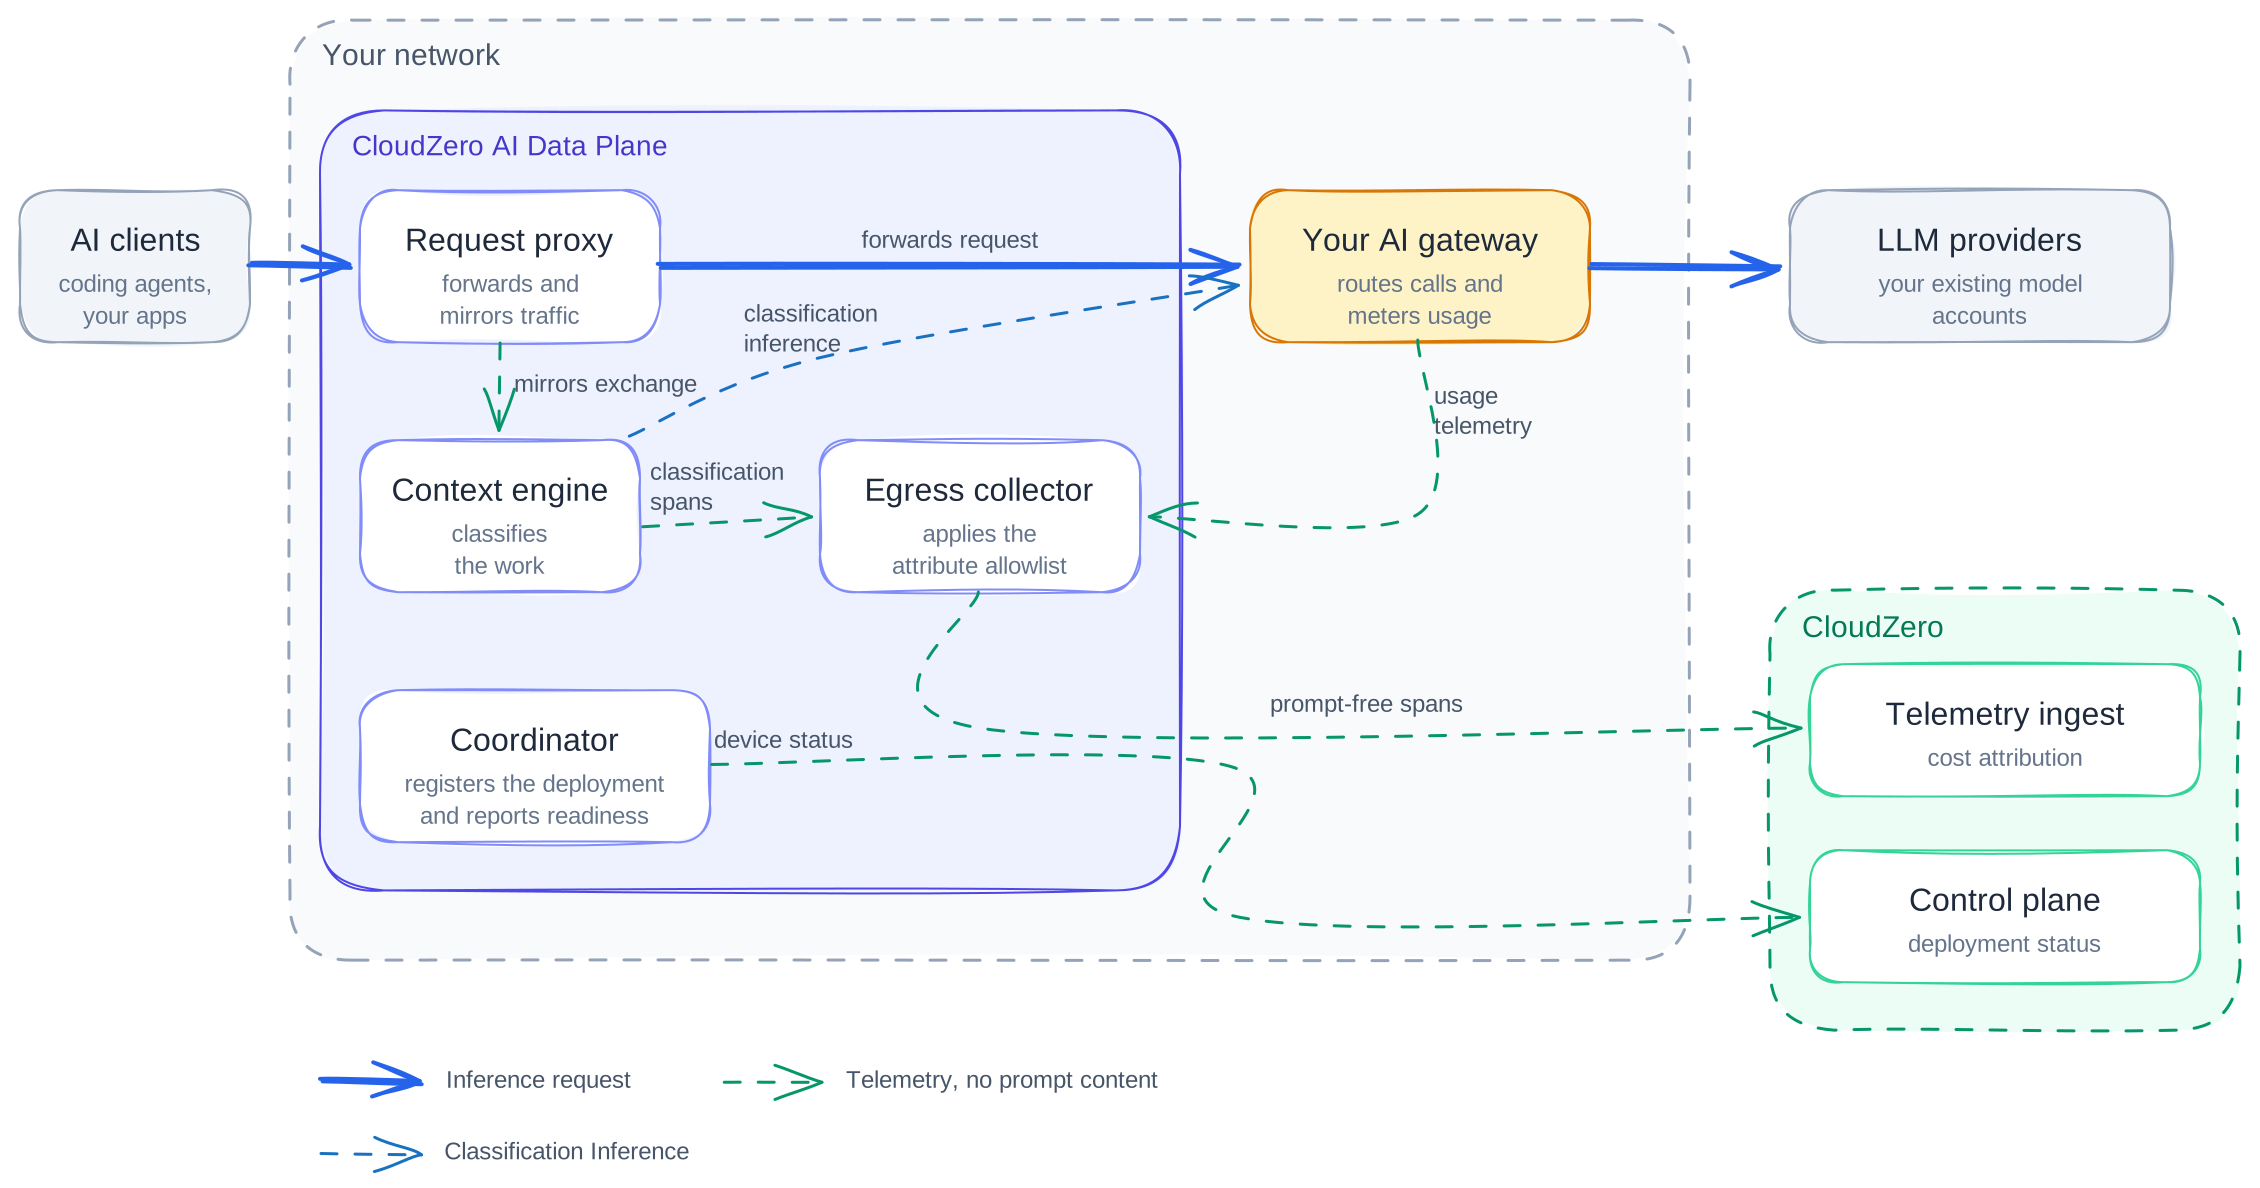
Classification happens outside the forwarding path. Each request reaches your gateway right away, and a separate copy is analyzed for classification in the background. The one change on the request itself is trace context, added to recognized requests so cost can be joined to attribution later, and the request is forwarded whether or not that step finishes in its budget. If classification falls behind or stops, your inference requests and provider responses are unaffected. The only consequence is a temporary gap in attribution coverage, never a blocked request.
Components
| Component | What it does |
|---|---|
| Request proxy | Receives the inference requests you route to it, forwards them to your AI gateway, and mirrors recognized exchanges for analysis. Forwarding does not wait on analysis. |
| Context engine | Reads the mirrored exchange and classifies the work behind it, including repository, branch, pull request, and configured work item. |
| Egress collector | Receives classification spans and your gateway's usage telemetry, keeps the two streams separate, stamps your deployment's identity on each, and exports both to CloudZero. |
| Coordinator | Registers the deployment with CloudZero and reports component versions and readiness. It stays off the telemetry path. |
Two pieces stay yours. Your AI gateway (LiteLLM, Bifrost, or another gateway you control) keeps routing your inference, and your LLM providers keep billing you directly. CloudZero does not route your inference or resell it.
The diagram above shows the shape of the system. For how it is deployed, what it touches, and how it behaves when something fails, see AI Data Plane architecture.
Monitor your deployment
Once deployed, your Data Plane and its connected AI gateway appear as devices in the Control Plane tab in AI Signals. Contact your account manager to enable Control Plane access for your organization.
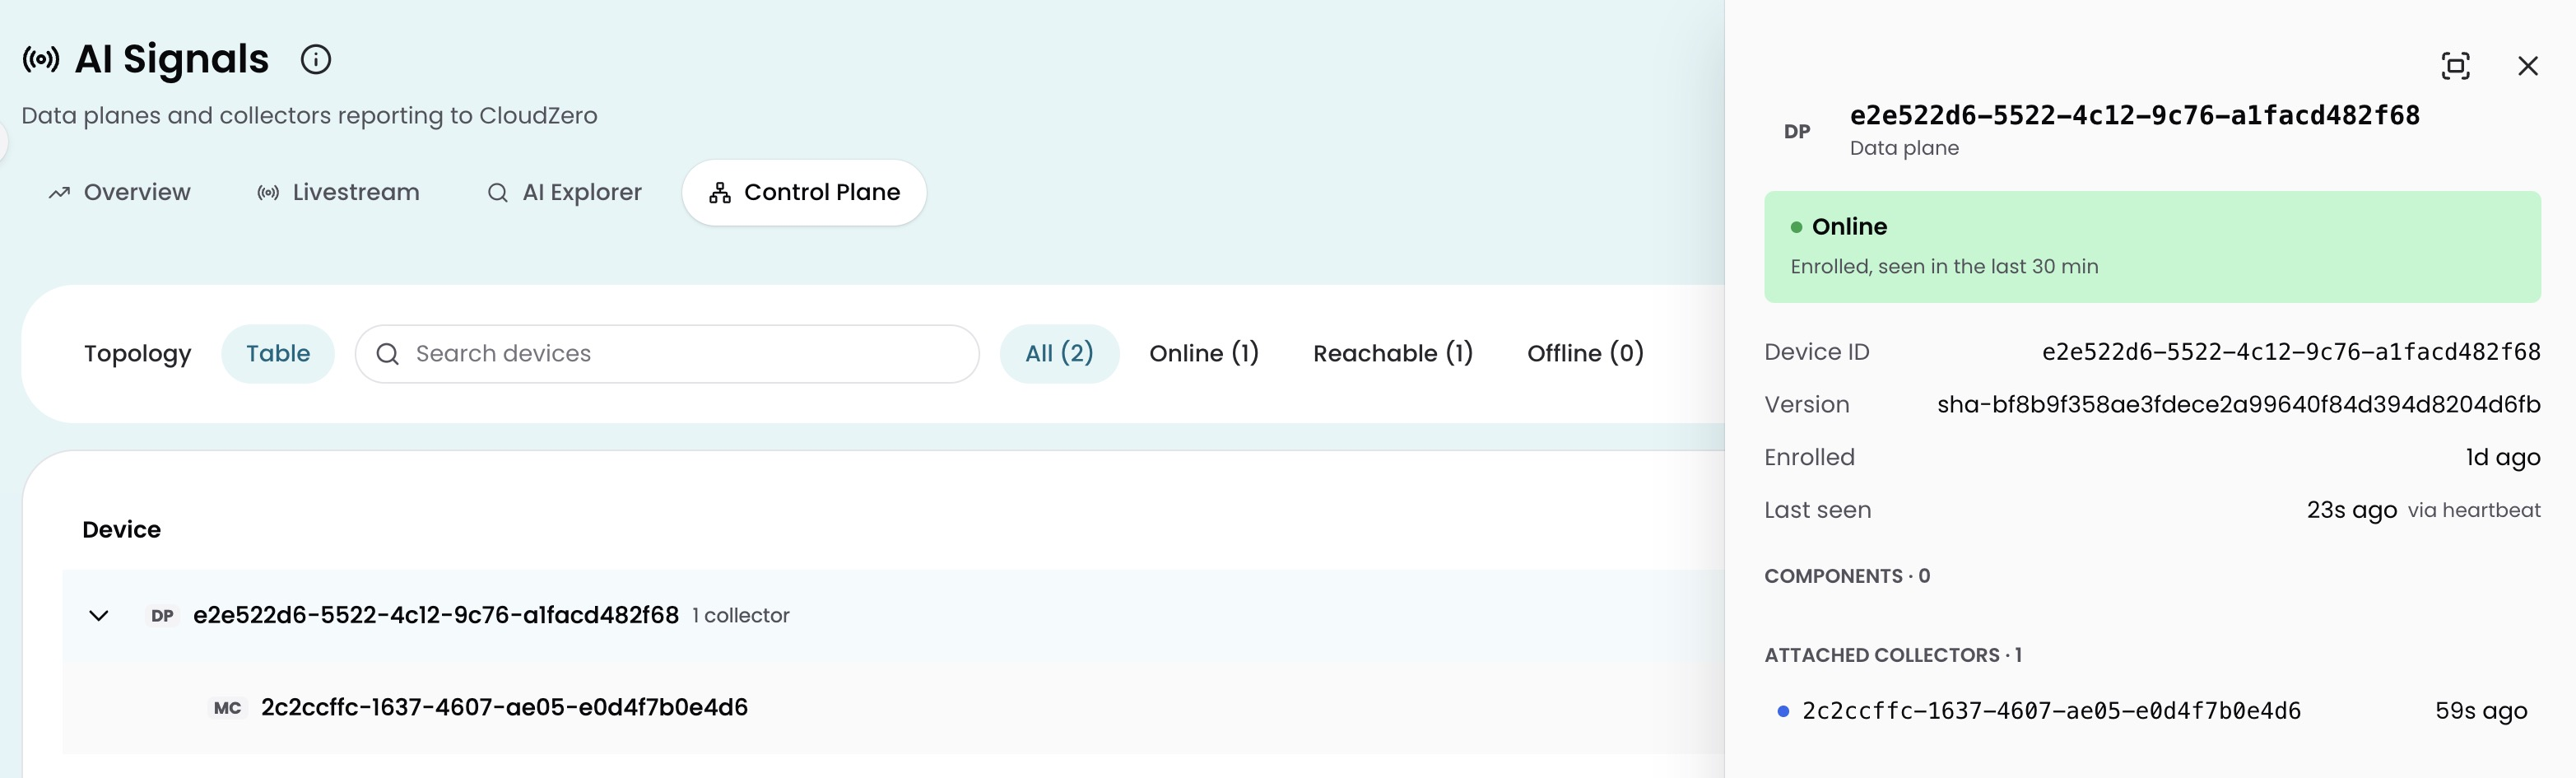
The Table view lists your Data Plane as a parent device, with your AI gateway nested underneath it as an attached device. The Topology view shows the same relationship as a graph.
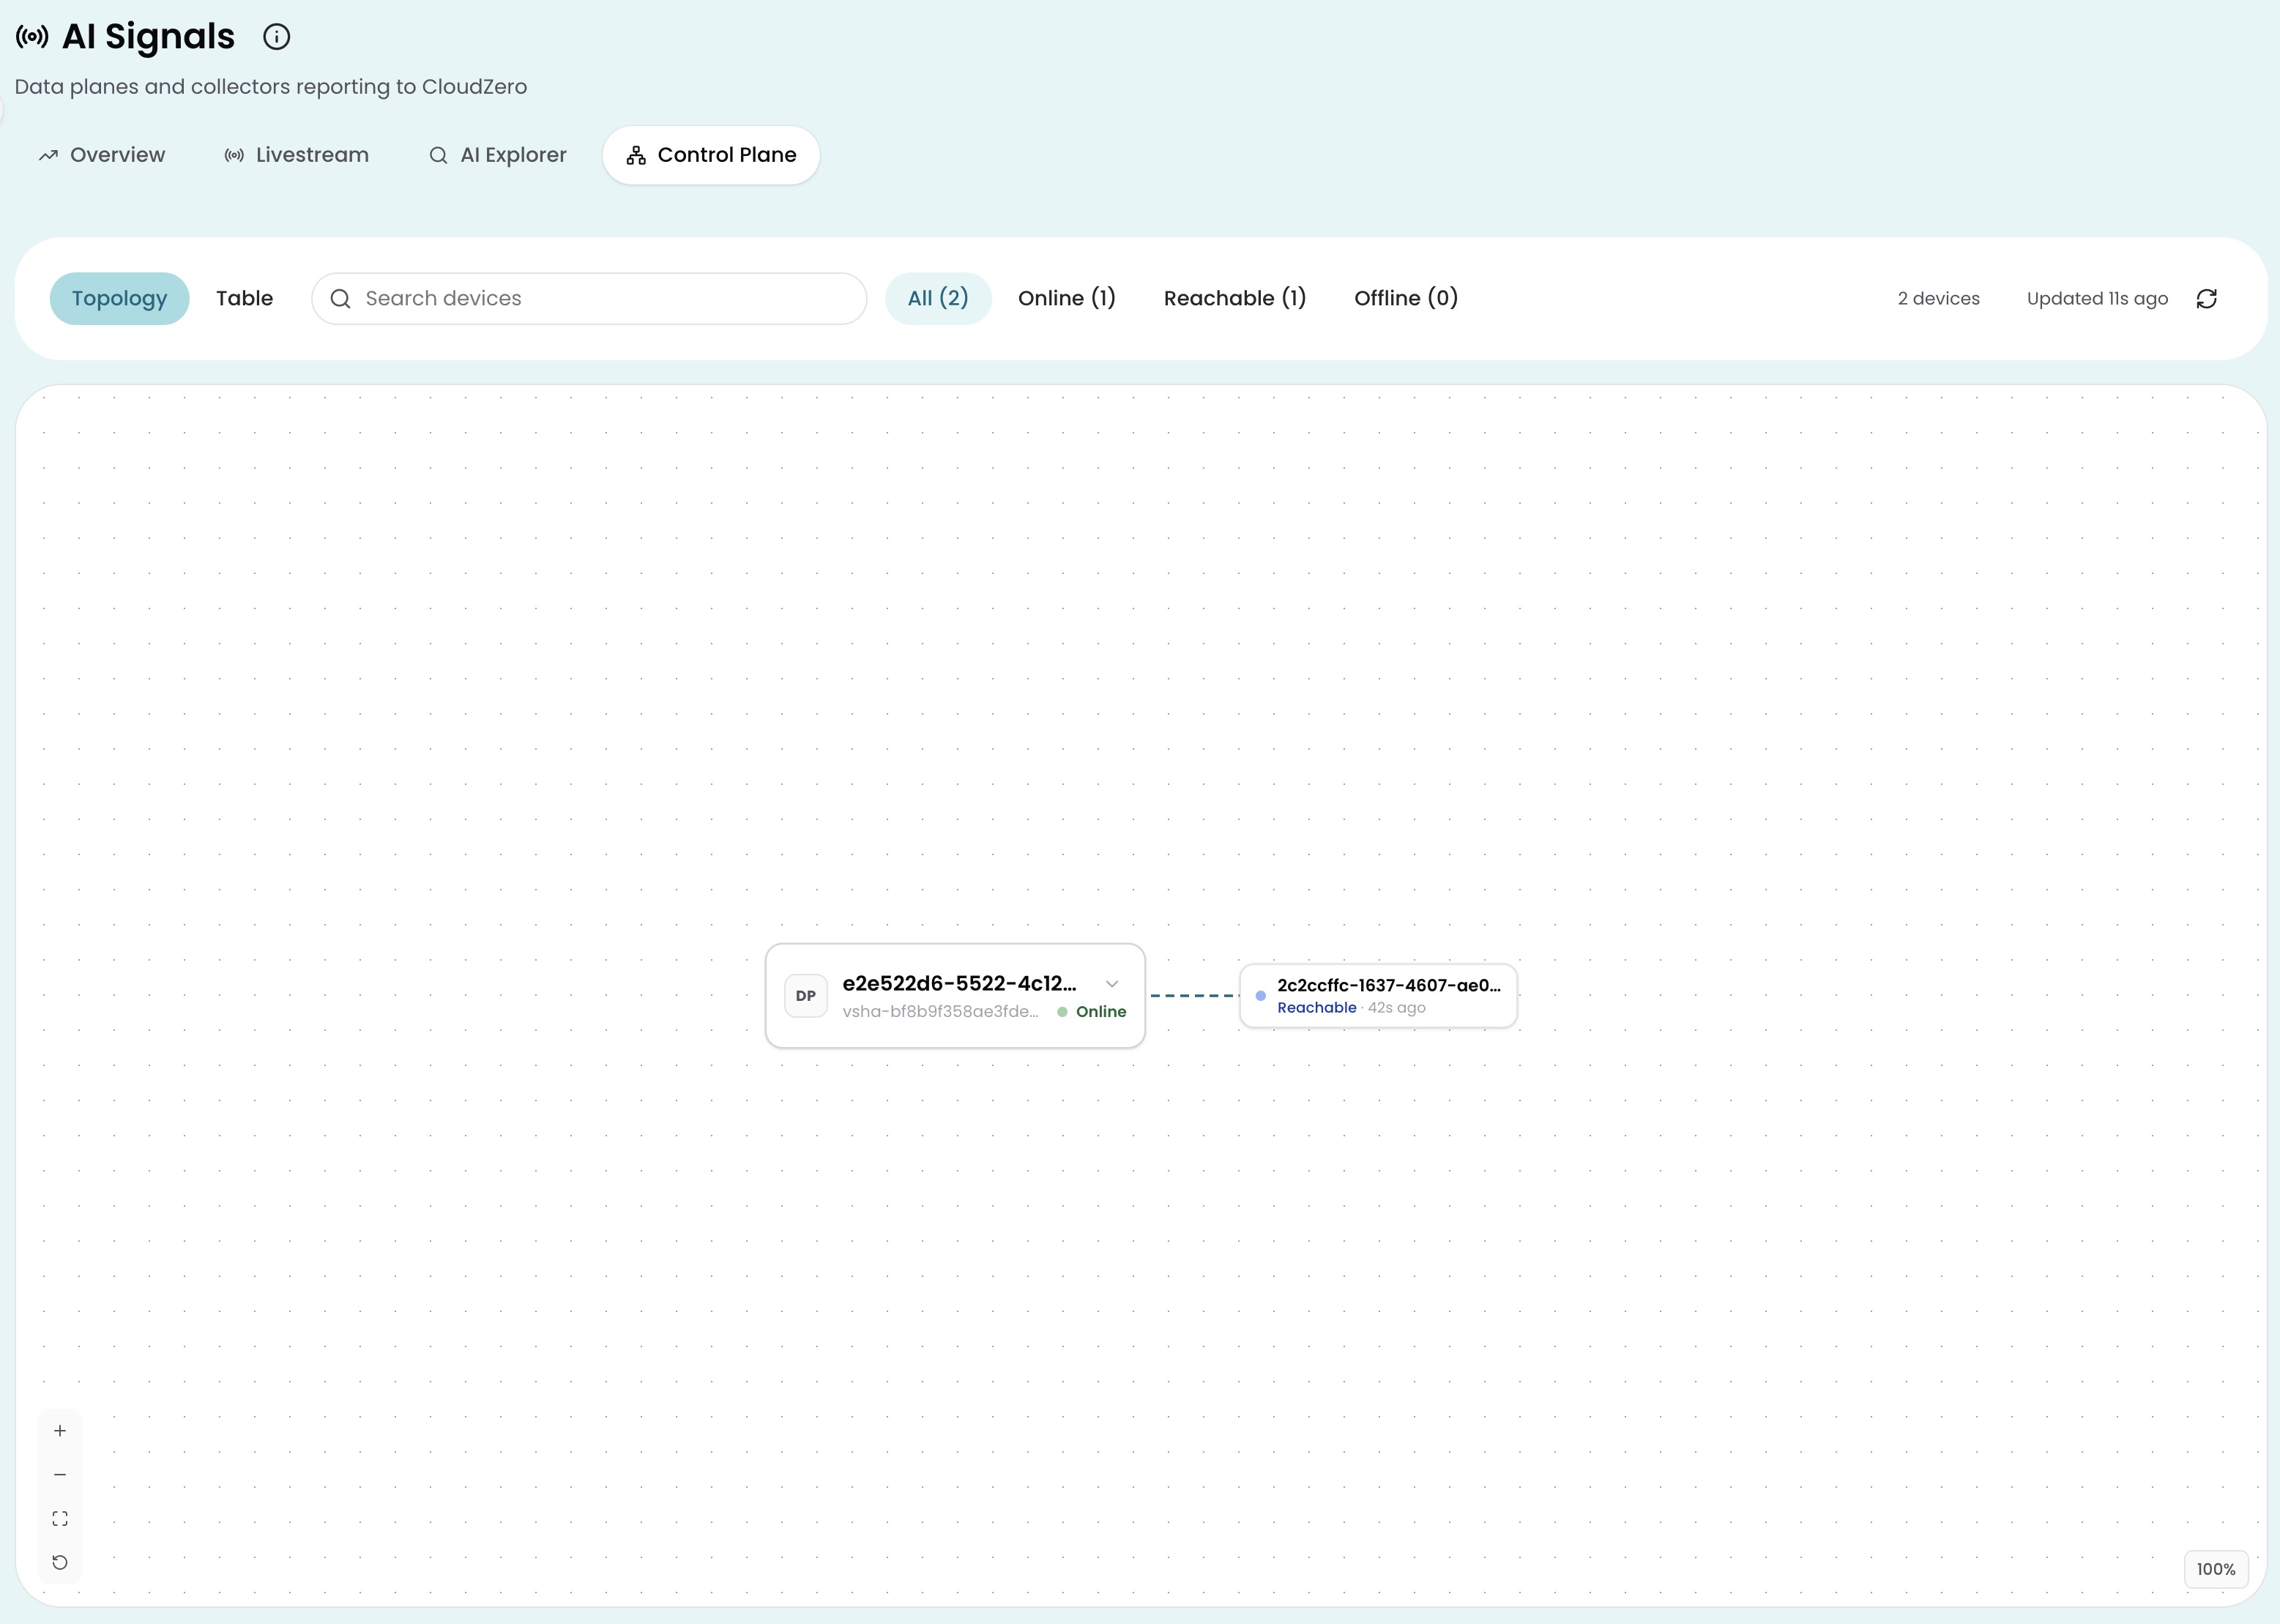
Each device reports one of three statuses:
| Status | What it means |
|---|---|
| Online | The device has its own heartbeat and checked in with CloudZero within the last 30 minutes. This is how your Data Plane reports itself. |
| Reachable | The device is working, confirmed through your Data Plane rather than a direct connection to CloudZero. Your AI gateway shows this status because it doesn't run its own CloudZero agent, so its Version field shows a dash. |
| Offline | The device isn't currently reporting or reachable. |
Selecting a device opens its details: Device ID, Version, Enrolled (when it registered), and Last seen. Your Data Plane also lists its Attached Collectors (currently your AI gateway); the gateway's own panel names its Parent data plane in return.
The Control Plane tab tracks your Data Plane and the AI gateway connected to it.
CloudZero never receives your prompts
Your AI gateway continues to forward each request to your LLM providers exactly as it does today. That path doesn't change, and it has nothing to do with CloudZero.
What changes is the mirrored copy the AI Data Plane analyzes. That copy has exactly two destinations, both under your control: a local working store inside the deployment, and the classifier you configure and authorize.
CloudZero receives prompt-free spans carrying a fixed set of attributes, structured fields like repository, branch, pull request, and work item identifiers, never free-text prompt or response content. That list is compiled into the exporter rather than set by a configuration toggle, so a span has no path to carry anything else. For the complete field-by-field contract, including what your gateway's own telemetry adds, see AI Data Plane telemetry schema.
Attribution and cost arrive as two streams
The AI Data Plane names the work. Your AI gateway owns the dollar figure. Reading AI spend by business context takes both:
| Stream | Source | Carries |
|---|---|---|
| Attribution | AI Data Plane | Which work each conversation turn was doing |
| Usage | Your AI gateway | Tokens, models, and cost |
The two streams join into a single number, what this work cost, when your gateway is configured to export its own usage telemetry to the AI Data Plane alongside the attribution stream. Without that export, you see which work happened, not what it cost. The telemetry schema names the identifiers the two streams join on, and explains why a joined number reflects the turn's closing call.
Once joined, AI costs land in CloudZero next to your cloud and SaaS spend. Allocate them with the same Dimensions and rules you already use, measure cost per unit, and track them in Dashboards. For real-time AI spend visibility without a network deployment, see Real-Time AI Spend with AI Signals.
Questions you can answer
- What did work on this repository, branch, or pull request consume?
- Which work items account for the growth between two periods?
- How much of a conversation's consumption came from delegated child agents?
- Which teams and product lines are driving the change in AI spend?
Classifications are model results validated against your configuration. Confirm your coverage before using them for chargeback.
What the AI Data Plane works with
The AI Data Plane reads traffic you route through it, so a few things about your environment determine how much of your AI spend it attributes:
- AI clients you can point at a gateway you control. Claude Code reads
ANTHROPIC_BASE_URL, and Codex reads a configured provider base URL. - Inference over HTTP or streamed responses (Server-Sent Events), using the Anthropic Messages, Chat Completions, or Responses formats.
- A gateway that carries request trace context through to its own telemetry (the W3C trace context standard). That shared context is what joins attribution to cost.
- A gateway configured to export usage telemetry to the AI Data Plane, so cost arrives alongside attribution.
Those last two points are the whole gateway requirement. Any gateway that exports OpenTelemetry usage spans and carries W3C trace context through to them works, and nothing in the AI Data Plane is built around a particular one.
Everything else you route through the AI Data Plane still reaches your gateway. Unrecognized request paths and WebSocket connections are proxied without analysis, so they produce no attribution. Use HTTP or streamed responses for the traffic you want attributed.
Coverage is expanding to include more AI clients, providers, and gateways.
Skip classification for a request
Keep classification spend focused on the traffic you want attributed. Some requests don't need it, such as high-volume workloads your own code drives, where you already know what the work is. A client skips classification for any request it marks with the opt-out header, and the request still reaches your gateway through the AI Data Plane.
To skip classification: Send the header x-cloudzero-classification-opt-out: true on each request. The value matches true in any letter case, with surrounding spaces ignored. Any other value, including 1, yes, and false, is classified normally.
To opt out a Claude Code session, add the header through the ANTHROPIC_CUSTOM_HEADERS environment variable:
ANTHROPIC_CUSTOM_HEADERS='x-cloudzero-classification-opt-out: true' claudeFor a request carrying the header, the AI Data Plane:
- Forwards the request to your gateway and returns your gateway's response
- Adds no trace context, opens no conversation turn, and makes no classifier call
- Exports no
cz.contextspan
Your gateway still records the request's usage. When your gateway exports usage telemetry, that usage arrives in CloudZero without AI Data Plane attribution, because no cz.context span exists to join it to. It carries whatever your gateway exports: token counts, and cost only if your gateway reports it. For how the two streams join, see AI Data Plane telemetry schema.
The header is self-declared and not authenticated. Anyone who can send requests to the AI Data Plane can set it on their own requests, and it skips classification only for the request that carries it.
Opt out whole sessions
Apply the header to every request in a session or workload, not to some of them. An opted-out request is invisible to the AI Data Plane's conversation-turn tracking. In a session that mixes opted-out and normal requests, an open turn stays open until the next normal request, so attribution for that session becomes unreliable.
Confirm the opt-out is working
The response carries no confirmation header. Two signals confirm the skip:
- The context engine's
cz_ai_data_plane_intake_classification_opt_out_totalmetric increases by one for each skipped request. - The response has no
traceparentheader. A classified request that arrives without trace context gets one back, so a missingtraceparentis a quick first check.
Get started
The AI Data Plane deploys as software into infrastructure you run, so the rollout is scoped to your environment, your gateway, and your security review. AI Data Plane architecture is what your operations team needs to vet the design, and AI Data Plane telemetry schema is the data contract they will review.
Reach out to your account manager to walk through the architecture, confirm coverage for your AI clients and gateway, and plan a deployment.
Have questions or feedback? Reach out to your account manager.
Updated 5 days ago