

CapEx Classification
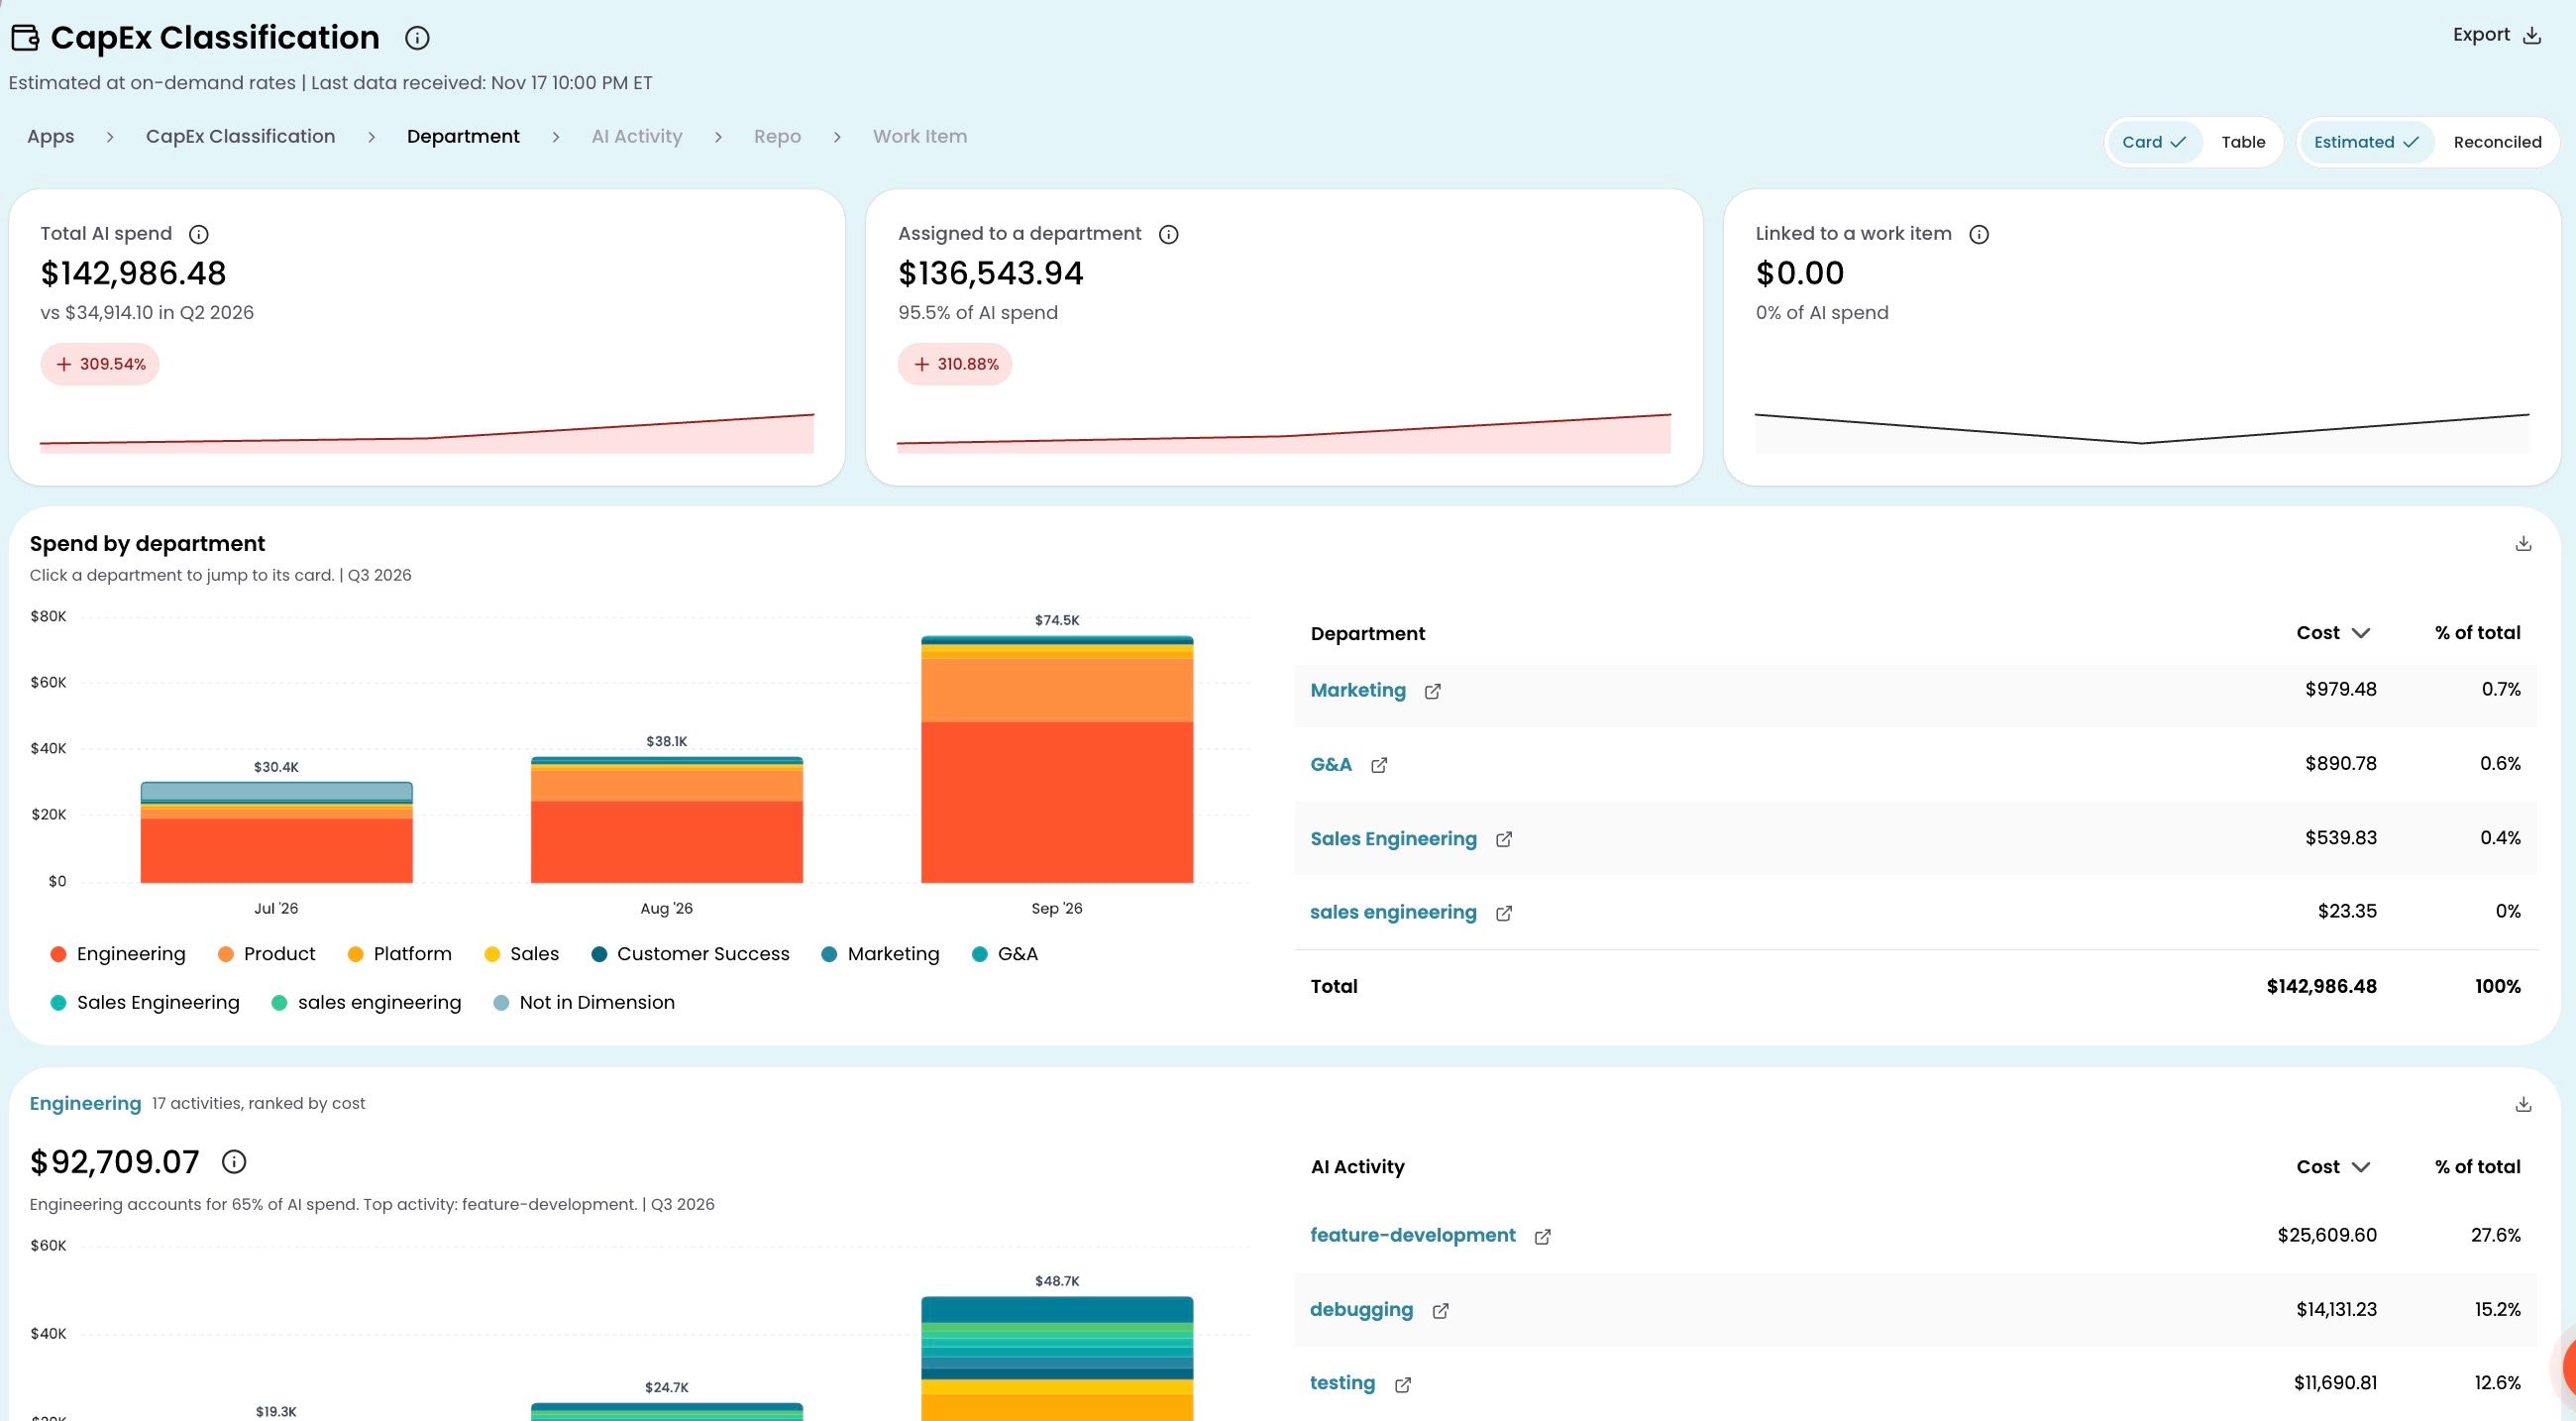
CapEx Classification breaks down your AI spend by department, activity, repository, and work item so you can see which spend is capitalizable development work and prepare your quarterly CapEx report. CloudZero records this context for every AI coding session automatically, so you do not have to build it by hand.
Coverage and capabilities are expanding. To get started, reach out to your account manager.
To open it, go to Apps > Finance > CapEx Classification.
What capitalization means
Capitalizing software work means treating certain development costs as an asset rather than an operating expense. To do that, finance needs proof: who did the work, what kind of work it was, which project it was for, and how much it cost. CapEx Classification provides that breakdown using data CloudZero collects from your AI platforms.
Controls
The date range defaults to the last full quarter. Change it to another quarter, a specific month, or a custom range. Select Estimated for directional data available sooner, or Reconciled for actual provider billing.
Navigating the data
Three KPI cards at the top summarize total AI spend, the portion assigned to a department, and the portion linked to a work item.
Below the cards, Spend by department shows how spend is split between teams, month by month. Each department has a card showing its AI activities ranked by cost, such as feature development, code review, or pull request review. This is where you see which work looks like new development (capitalizable) and which looks like maintenance or support (operating expense).
CapEx Classification supports four levels of drill-down:
Department > AI Activity > Repository > Work Item
Click any value to drill into the next level. The breadcrumb at the top of the page shows where you are and lets you jump back to any previous level.
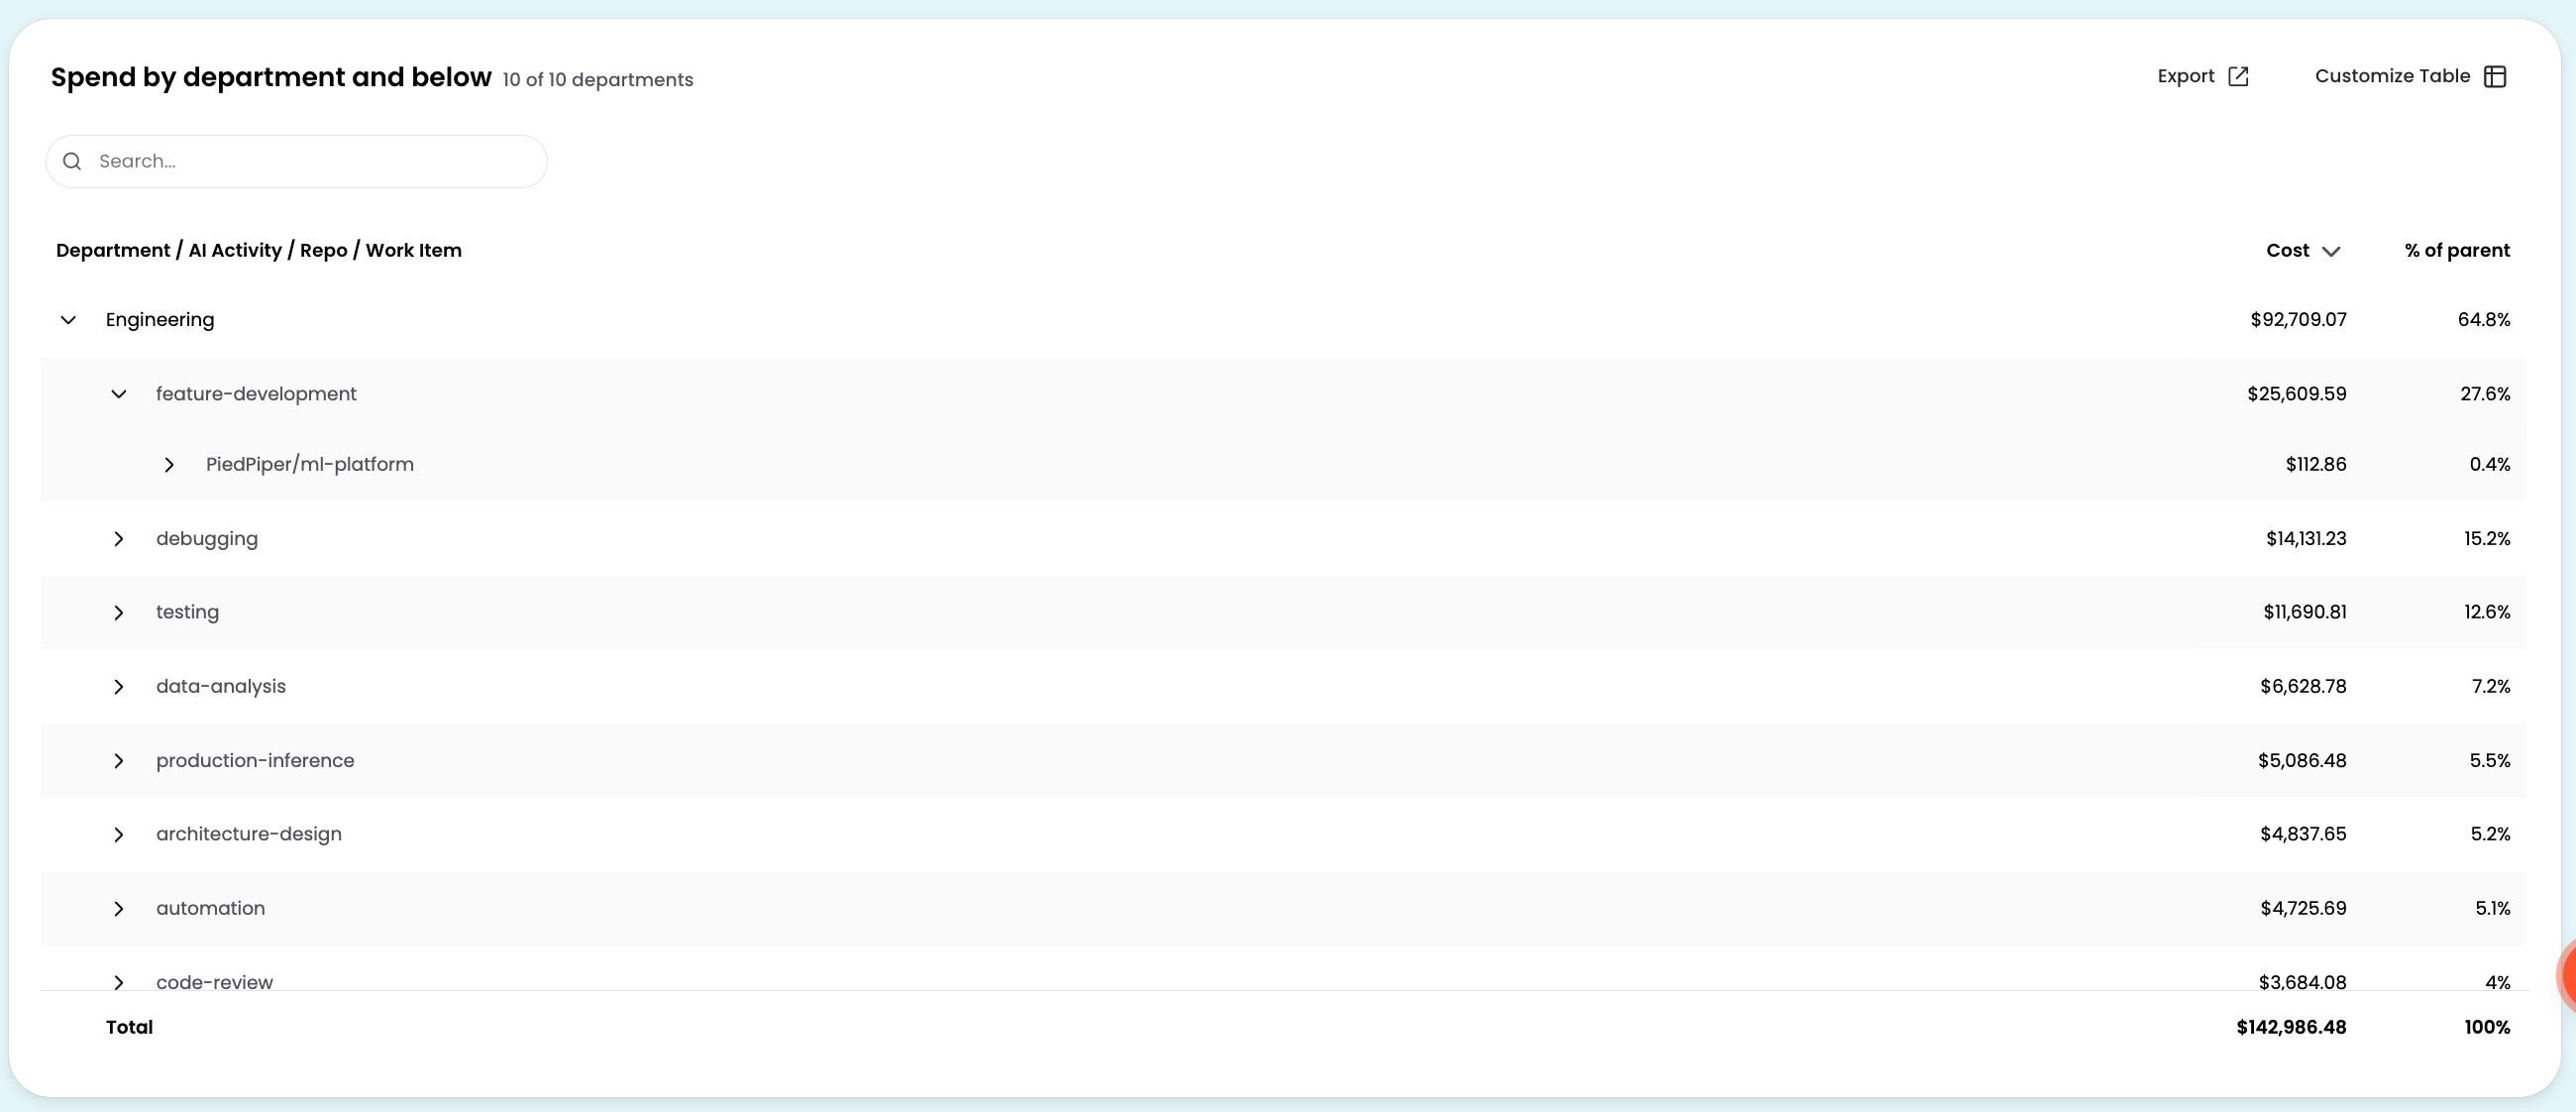
Toggle between Card View and Table View using the control at the top of the page. Card View displays visual breakdowns at each drill-down level. Table View renders all data in a flat, sortable table where you can expand any row to see its children. The % of parent column shows how much each row contributes to the level above it.
Have questions or feedback? Reach out to your account manager.
Updated about 12 hours ago