Unit Economics
Unit Economics lets you measure the cost of running your business at a granular level: cost per customer, cost per transaction, cost per API call, cost per feature, or any other metric that matters to your organization. CloudZero goes beyond single-dimension unit costs by letting you break these metrics across multiple Dimensions simultaneously, for example, cost per order per engineering team per product.
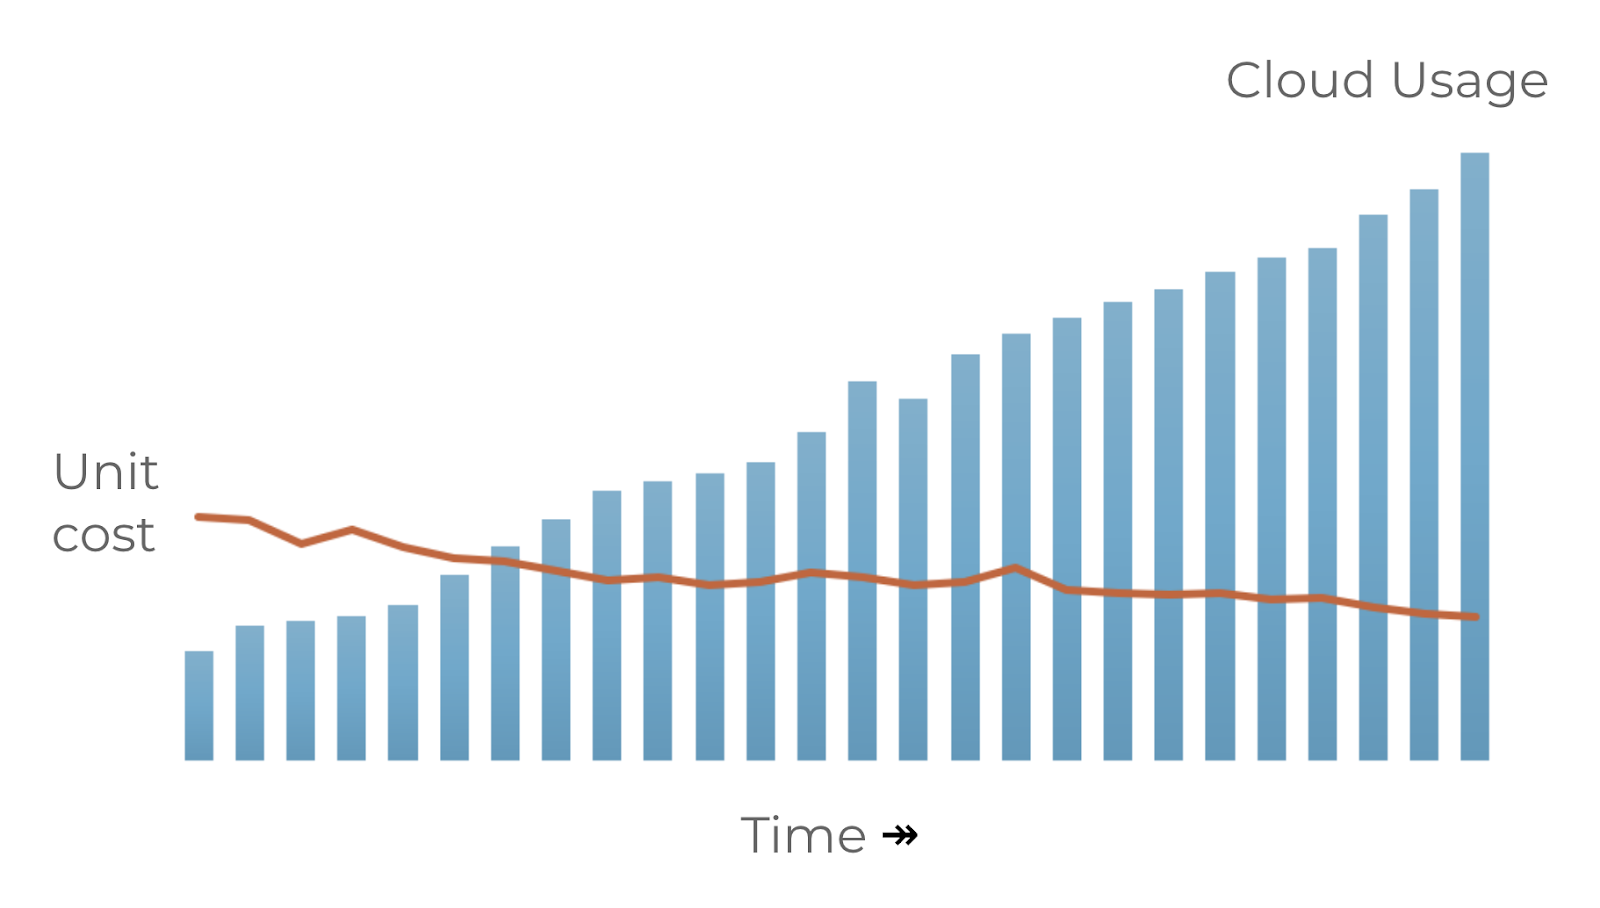
Understanding unit costs is critical for knowing whether your business is scaling efficiently. Total cloud costs almost always grow over time. Unit costs tell you whether that growth is healthy (more output for each dollar) or inefficient (more dollars for each unit of output).
How unit costs work
A unit cost is calculated as spend divided by a unit metric:
- Spend: the cloud cost you want to break down. This can be all spend, or a specific subset filtered by product, environment, service, or any other Dimension.
- Unit metric: a measurement from your business, such as daily active users, orders processed, API calls, or transactions. This data typically comes from an observability tool, database query, or application logs.
You send the unit metric to CloudZero through a telemetry stream (via the API or CSV upload). CloudZero divides your cloud spend by the unit metric to produce the unit cost, available in Analytics Dashboards and AI Hub queries.
Example
Suppose your daily cloud spend climbs from $10,000 to $15,000. That's a 50% jump that raises questions in isolation. But if your transactions tripled in the same window, your cost per transaction dropped from $0.05 to $0.025: the business is scaling more efficiently, not less. Unit costs are what reveal this.
Where to find your unit metric
You can use virtually any data source as long as you can convert it into the required format. The metric does not need to be perfect to start gaining insights. Start simple and add more telemetry streams over time; each one increases accuracy.
- Application and system metrics: tools like Grafana, Prometheus, and CloudWatch Metrics can provide usage data such as daily active users. Metric-formatted data is typically the easiest and least costly to query.
- Application and system logs: web server logs can be aggregated to determine unique daily active users or request counts. Logs are verbose, so processing them may cost slightly more than metric data.
- Database queries: a query can provide metrics not available in observability tools, such as total transactions per day or new records created.
- Marketing and sales systems: site visits, sales volume, and other metrics tracked by marketing and sales teams.
- Security systems: security teams often have valuable data, but confirm compliance requirements before using it.
Get started with Unit Economics
- Identify the spend you want to break down. Create a View that filters to the relevant costs.
- Identify a unit metric from your business (users, orders, API calls, etc.) and a data source for it.
- Send the metric to CloudZero via the API or by uploading a CSV.
- Build a Dashboard in Analytics to visualize your unit cost over time.
For a complete walkthrough using sample data, see Tutorial: Create a Unit Cost Dashboard.
Learn more
- Send unit cost and allocation data: start here to send measurements via CSV or API
- Telemetry API examples: API payloads for different scenarios
- Unit Cost Metric API: API reference for sending telemetry data
Have questions or feedback? Reach out to your account manager.
Updated about 2 months ago