Anomalies in Explorer
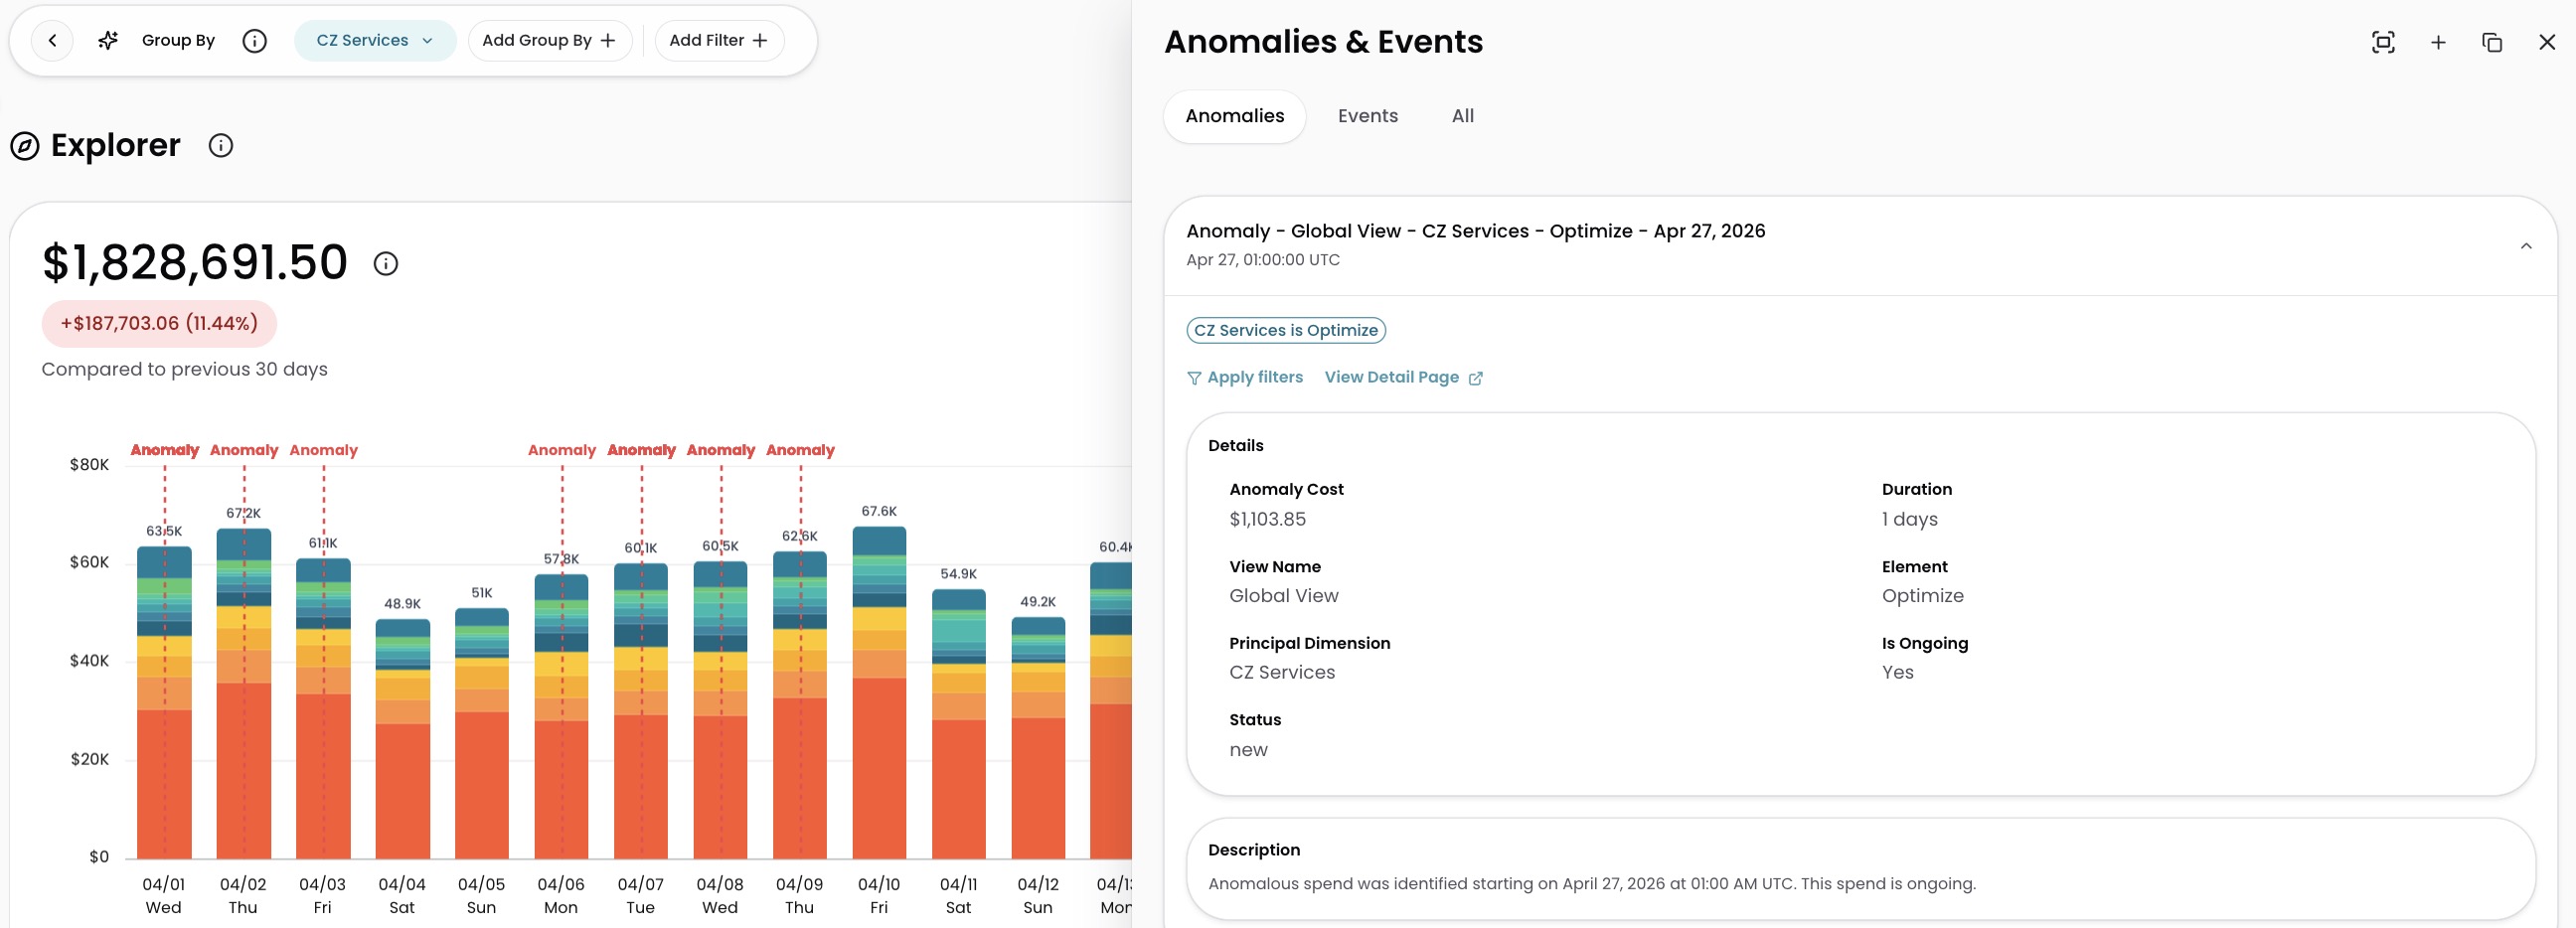
The Anomalies panel in Explorer overlays detected anomalies directly on the cost graph.
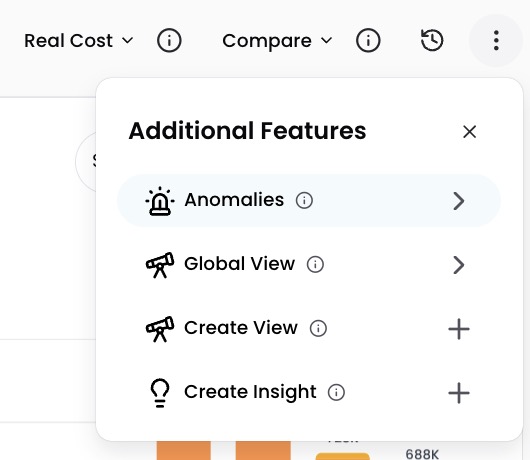
To open the panel, click the Additional Features menu ( ⋮ ) in the top-right corner of Explorer, then select Anomalies. Anomalies shows detected cost anomalies.
Anomalies
The Anomalies tab displays cost anomalies that CloudZero has detected for the current time range and filters. Anomalies appear as markers on the cost graph. Click an anomaly to expand it and see details including the cost impact, affected resources, and when it was detected. For example, if your Azure storage costs spike overnight, the anomaly marker shows you exactly when it started and how much it cost above the expected baseline.
Set time granularity to Hourly when possible for a precise identification of when an anomaly was detected.
For details on how anomalies are generated, how thresholds work, and how to configure anomaly detection for your Views, see Anomaly Detection.
Have questions or feedback? Reach out to your account manager.
Updated 2 months ago