

People
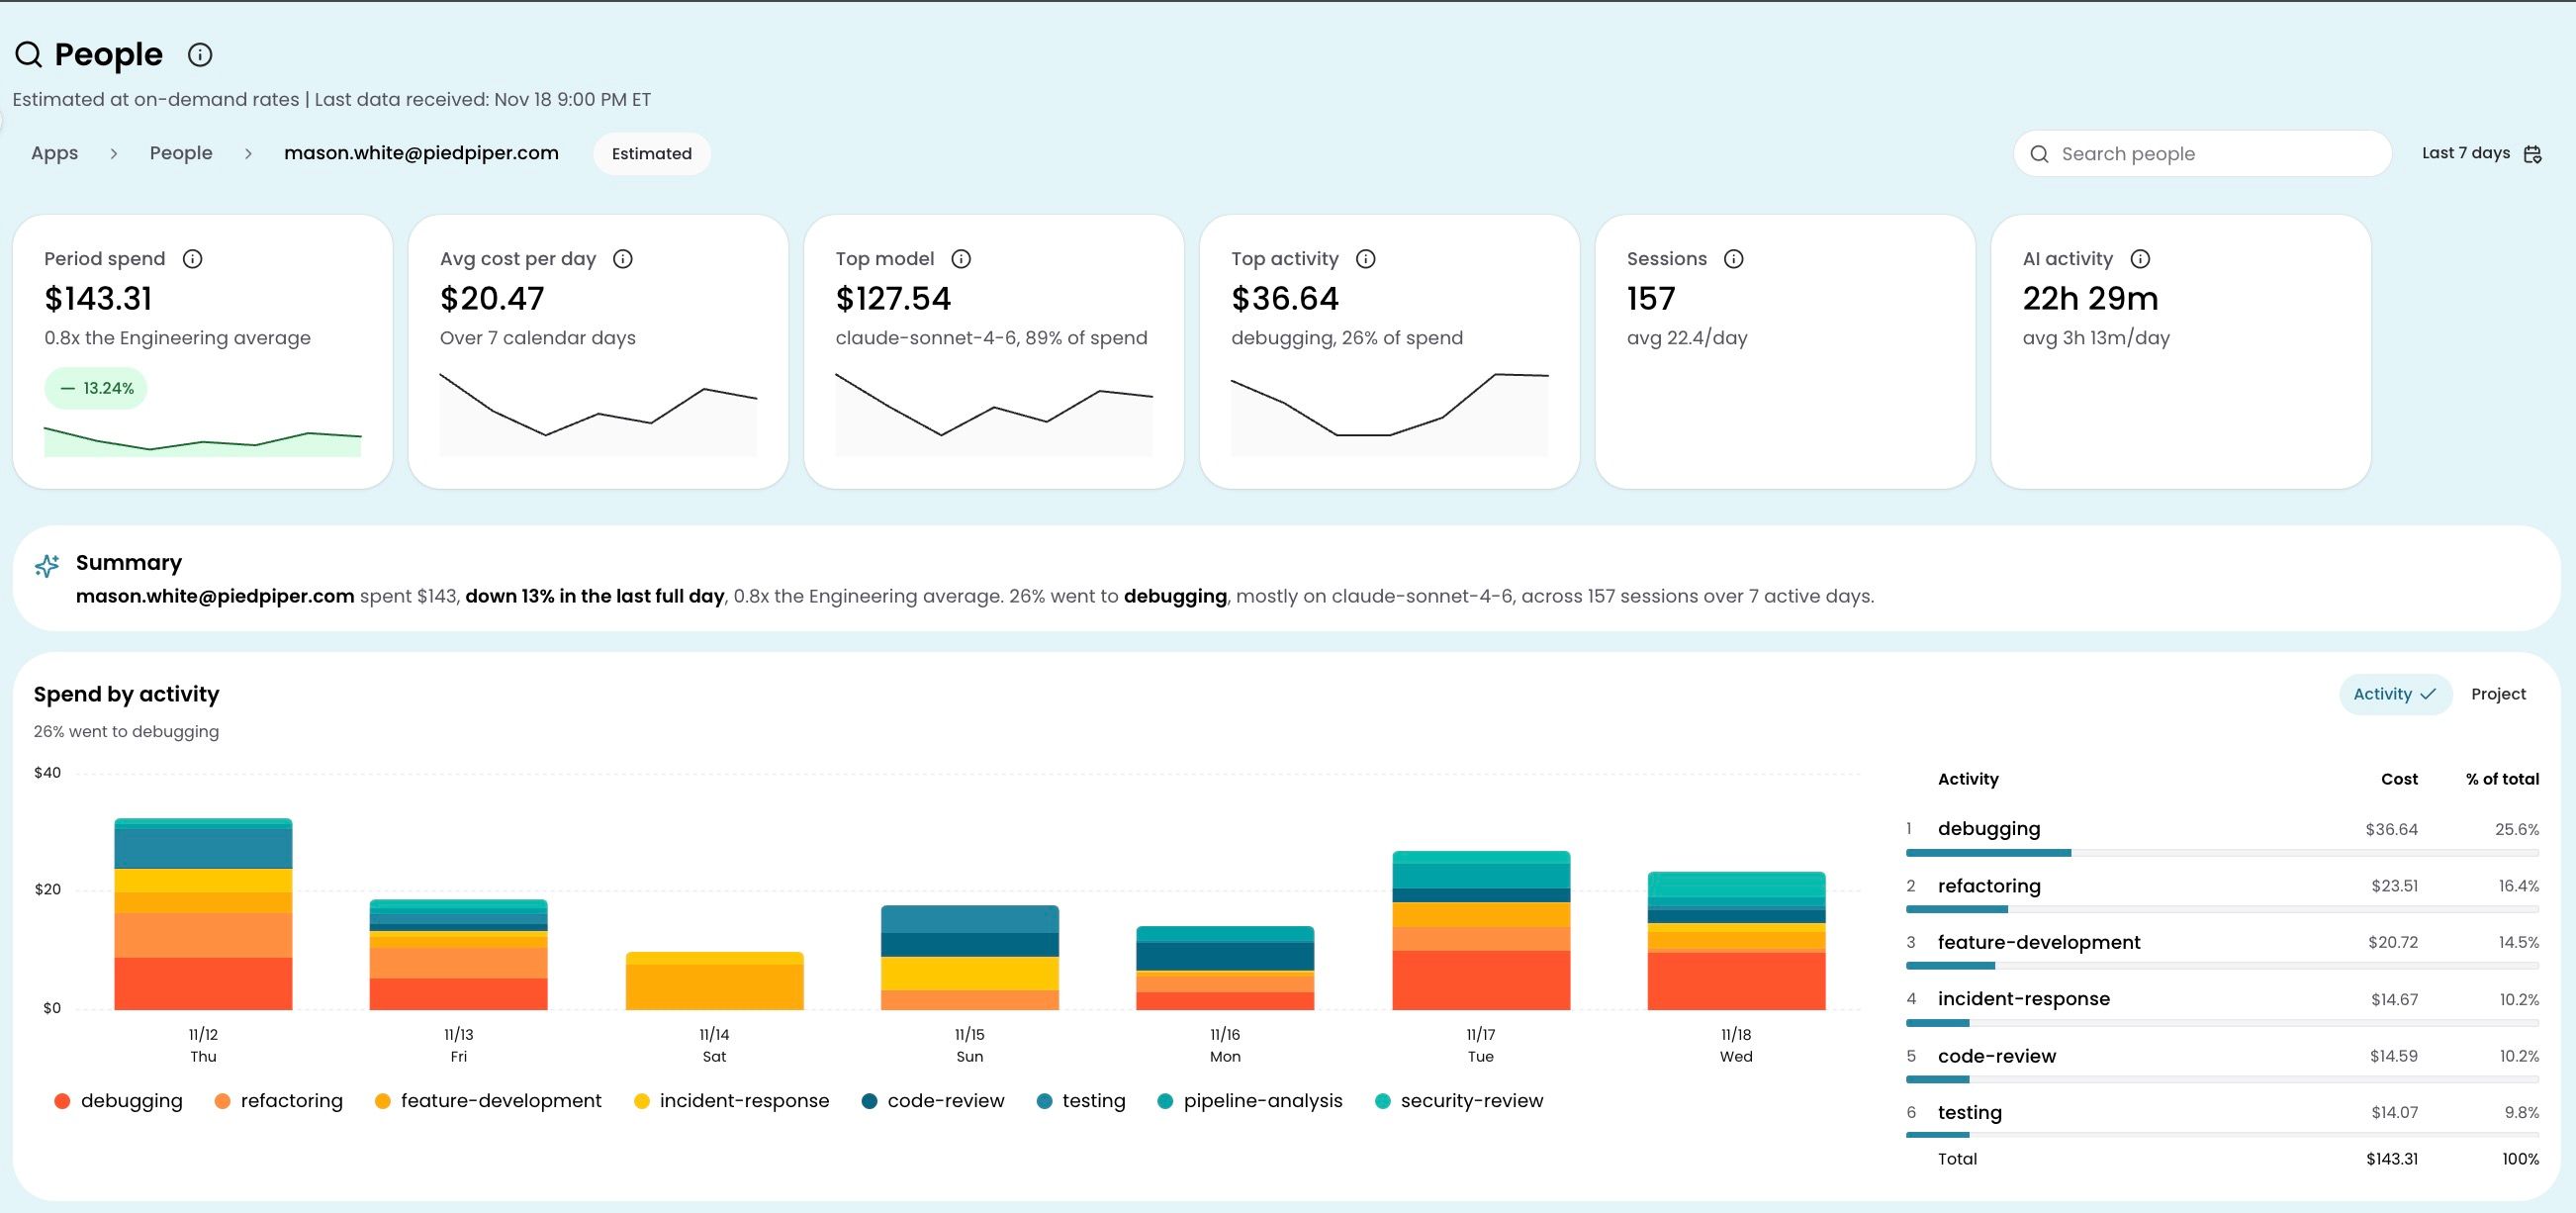
People shows how individuals in your organization use AI and what it costs. Search for a person to see their spend trend and peer comparison, check which AI tools and activities drive their cost, and drill into individual sessions for the full detail.
Coverage and capabilities are expanding. To get started, reach out to your account manager.
To open it, go to Apps > People.
Controls
People uses estimated spend calculated at on-demand rates. Use the search bar at the top of the page to find someone by name or email; you can switch between people without leaving the page. Change the date range in the top-right corner to adjust the period; every card, chart, and table updates to reflect it.
KPI cards
Six cards at the top summarize the person's AI usage for the selected period:
| Card | What it shows |
|---|---|
| Period spend | Total AI spend for the date range, with a comparison to the person's department average |
| Average cost per day | Daily spend averaged over the period |
| Top model | The AI model the person used most by spend |
| Top activity | The activity type (such as feature development or code review) that drove the most spend |
| Sessions | Total number of distinct AI sessions, with a daily average |
| AI activity | Total active minutes where the person had at least one AI request, with a daily average |
Spend by activity
A chart and table showing where the person's AI spend went by activity type (feature development, code review, debugging, and others) over the selected period. Each activity's share of total spend is visible at a glance, so you can quickly see whether cost is concentrated in one type of work or spread across several. Start here to understand what kind of work is driving cost before drilling deeper.
Peer comparison
The peer comparison card shows how the person's spend compares to their department average. Two horizontal bars display the person's total and the department average side by side, broken down by activity type. Each segment shows its percentage of total spend for both the person and the department average, so you can spot where the person's activity mix differs from their peers.
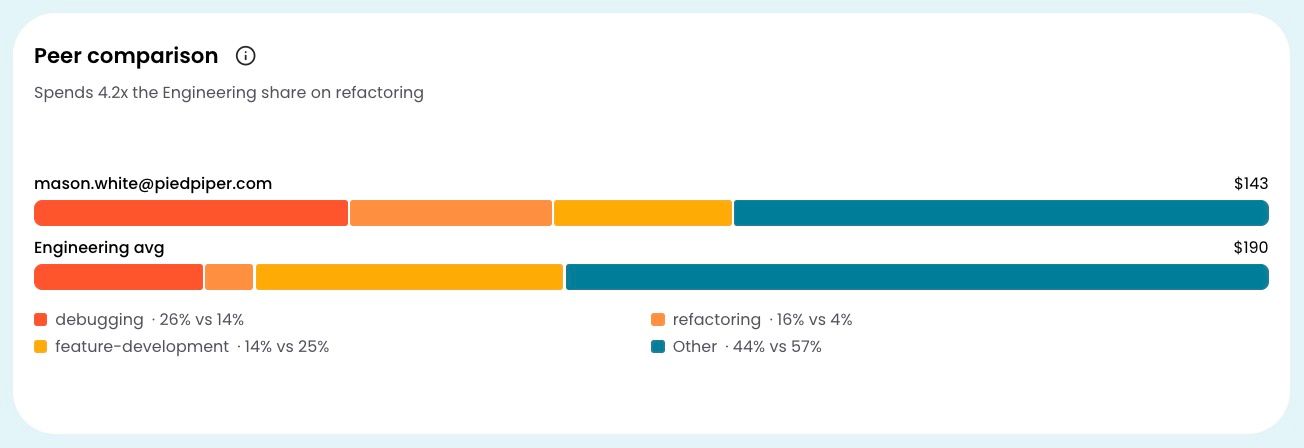
For example, if someone spends a larger share on feature development than the department average, that is immediately visible in the bar proportions. The AI tools used card next to it shows which clients the person reaches for (such as Claude Code, Cursor, or Copilot), with a toggle to view the model mix across them.
Sessions
The sessions table lists every distinct AI session the person started in the selected period. Click a session to open the session detail drawer, which shows:
- Session header: timestamp, AI client, and session ID
- Work item: the ticket or project the session was associated with, when available
- Activity and activity label: the classified activity type and a short description of what the person was doing
- Turns: each interaction within the session, listed in order. Expand a turn to see the model, input and output token counts, cache read tokens, finish reason, estimated cost, and API response time
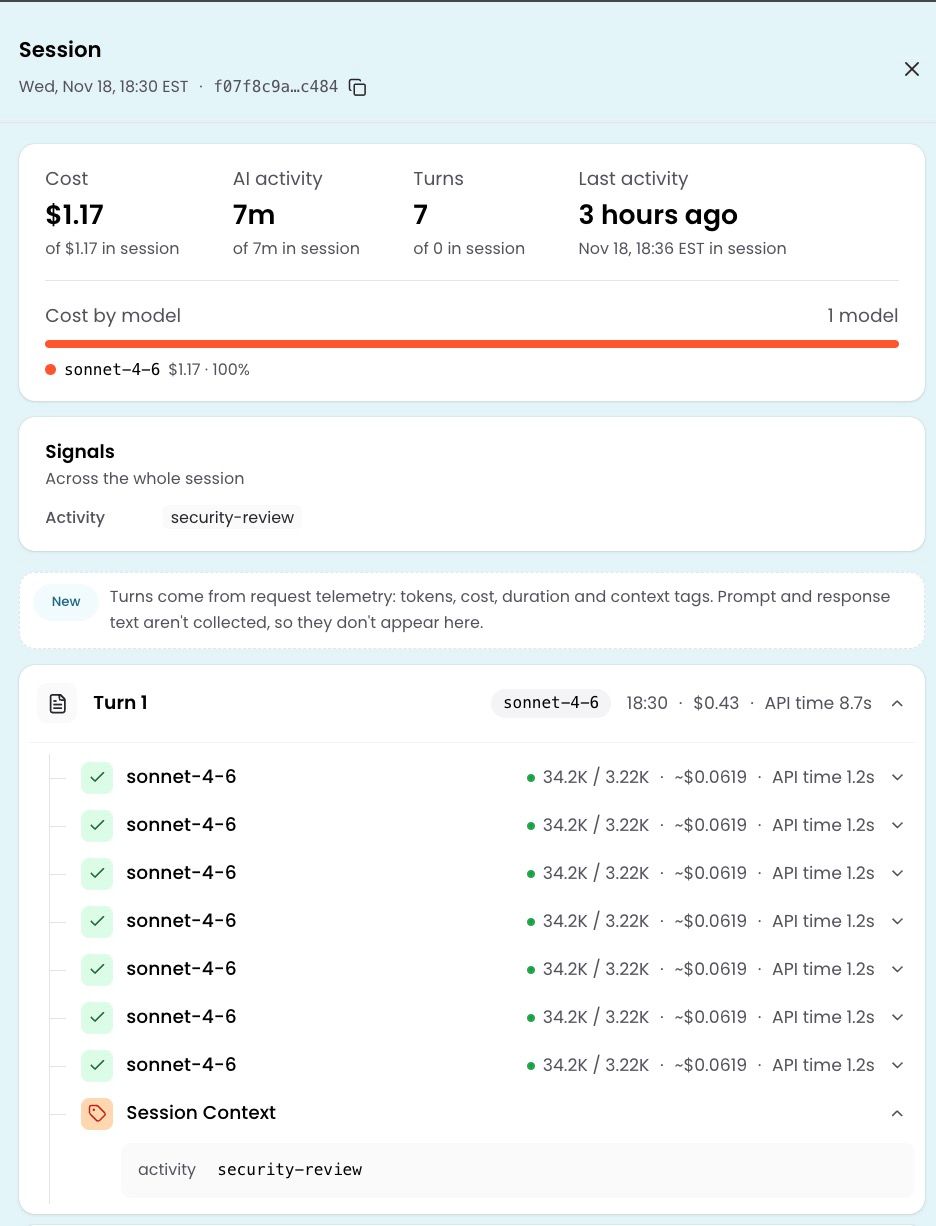
The work item appears beside each turn. To see the activity type and activity label for that portion of the session, expand the turn and then expand Session Context. These fields update as the session's work shifts between tasks.
Turns come from request telemetry. Prompt and response text is not collected, so it does not appear in the session detail.
For the most granular attribution outside of sessions, the spend breakdown drills from activity to repository to work item. Click any value to drill into the next level.
Have questions or feedback? Reach out to your account manager.
Updated about 16 hours ago