Creating and Editing Dashboards
Users with the necessary permissions can create custom Dashboards, edit existing ones, and organize them into folders. You can also duplicate CloudZero's standard Dashboards as a starting point for your own.
Analytics supports 13 months of data (the most recent 12 months plus the current month) for building Dashboards. Additional historical data is accessible through Explorer.
Create a Dashboard
-
Navigate to Analytics and select Create Dashboard.

-
Enter a Dashboard name.
A Dashboard inherits the visibility of the folder you create it in.
-
Select Create.

-
On the new Dashboard, select Add to add a tile: visualization, text box, Markdown box, or button.

-
If you add a visualization tile, select CloudZero Billing Data as the data source.

-
Select the billing data fields to build your visualization. Use the search field to find a field or browse through the Dimension categories.

-
Select Run to see the data populate. You can adjust fields and run again as needed.

-
To pivot the data, hover over a column and click the arrow icon. To add a filter, hover over a column and click the filter icon. You can filter by any field, including fields not shown in the data section (for example, date).
-
Enter a name for the visualization.

-
Select Save to save the tile.

-
Adjust the size and position of tiles as needed, then select Save to save the Dashboard.

For advanced tile customization, see the Looker documentation.
Edit a Dashboard
Rename a Dashboard
-
On the Analytics page, locate the Dashboard and click the ... menu in the Actions column.

-
Select Configure Dashboard.
-
Update the Dashboard name.
-
Select Update.
Edit Dashboard content
-
On the Analytics page, locate the Dashboard and click the ... menu in the Actions column.
-
Select Edit Dashboard.
-
Add, update, or remove tiles as described in Create a Dashboard.
-
Select Save.
You can also edit a Dashboard while viewing it by clicking the ... menu and selecting Edit dashboard.

For advanced tile editing, see the Looker documentation.
Copy a Dashboard
You can duplicate any Dashboard (standard or custom) and then edit the copy.
-
On the Analytics page, locate the Dashboard and click the ... menu in the Actions column.
-
Select Copy Dashboard. CloudZero creates a copy and opens it. The default name appends
(copy)to the original name. -
Edit the copy as needed and select Save.
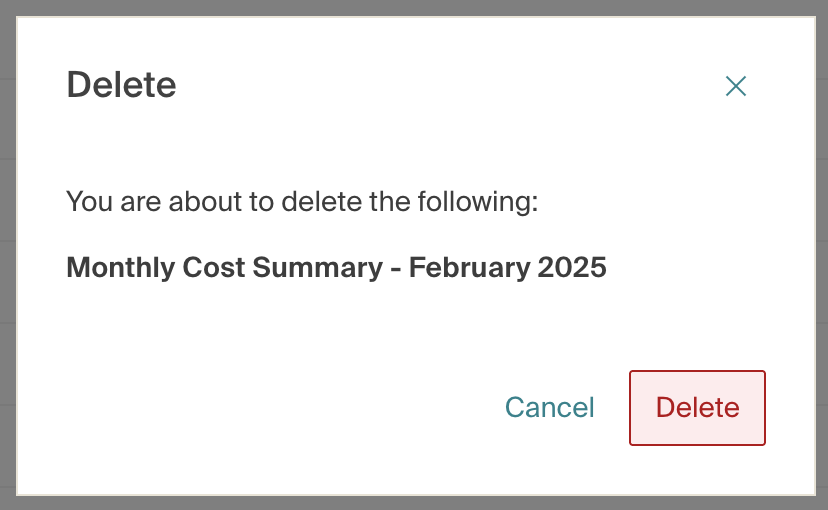
Delete a Dashboard
Deleting a Dashboard is permanent. If you delete a Dashboard by mistake, reach out to your account manager for assistance.
- On the Analytics page, locate the Dashboard and click the ... menu in the Actions column.
- Select Delete Dashboard.
- Confirm the deletion.
Change Dashboard visibility
Each Dashboard inherits the visibility of its parent folder. To change visibility, move the Dashboard to a different folder:
- Private: move to the Private folder
- Public: move to any public folder or the Dashboards Home
- Role-restricted: move to a folder configured for specific Roles
For details on moving, see Move a folder or Dashboard.
Manage folders
Folders let you organize Dashboards and control visibility. You can nest folders as deeply as needed.
Every user has a Private folder for private Dashboards. The Private folder cannot be renamed, deleted, or have its visibility changed. You cannot create folders inside it or move folders into it.
Create a folder
-
On the Analytics page, select Create Folder.

-
Enter a folder name (up to 100 characters).
-
Set the folder's visibility:
- Public: visible to everyone in your organization
- Roles: visible only to users with the Roles you select
-
Select Create Folder.
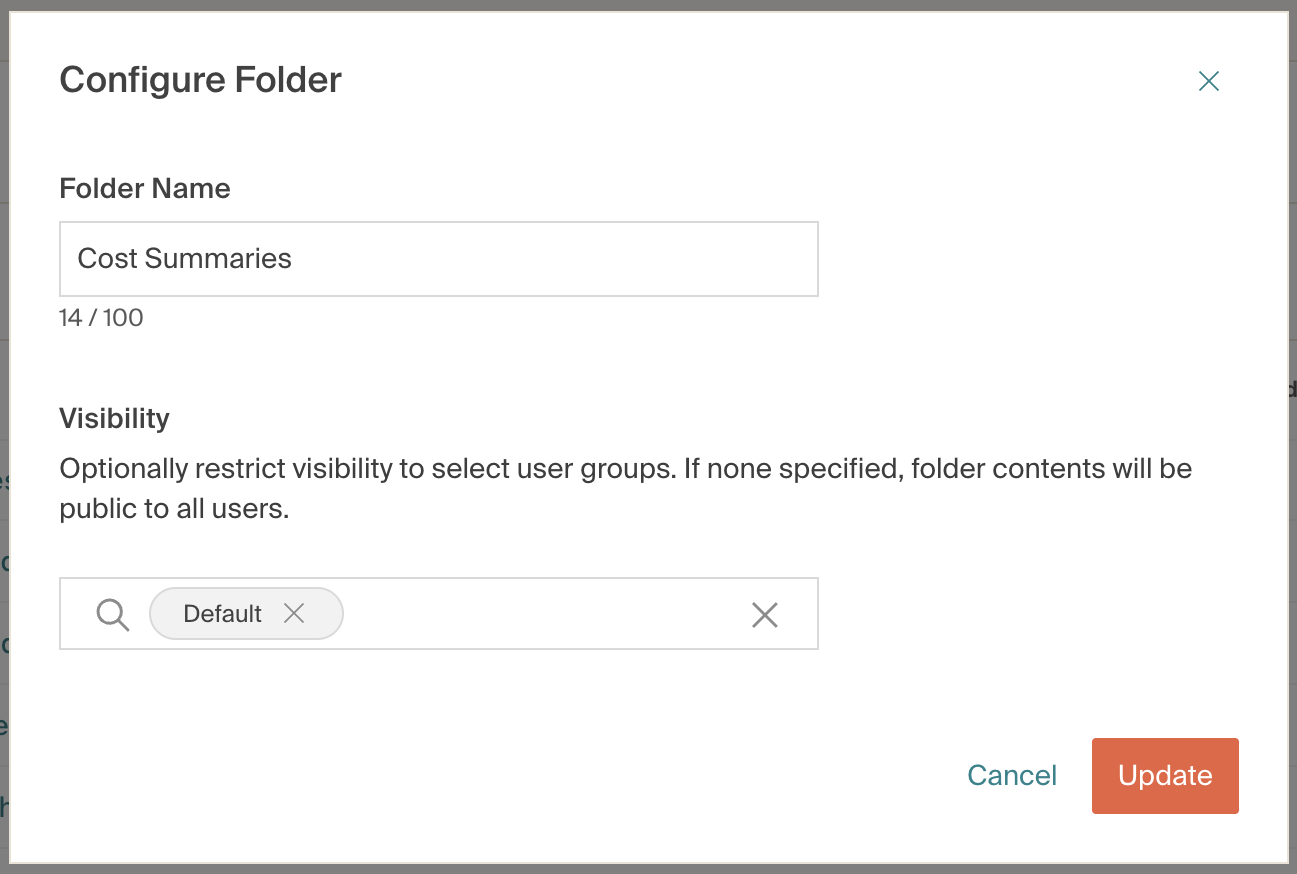
Configure a folder
-
On the Analytics page, locate the folder and click the ... menu in the Actions column.

-
Select Configure.
-
Update the name or visibility settings as needed.
-
Select Update.
Delete a folder
A folder must be empty before you can delete it. Move or delete any Dashboards inside the folder first.
-
On the Analytics page, locate the folder and click the ... menu in the Actions column.
-
Select Delete.
-
Confirm the deletion.
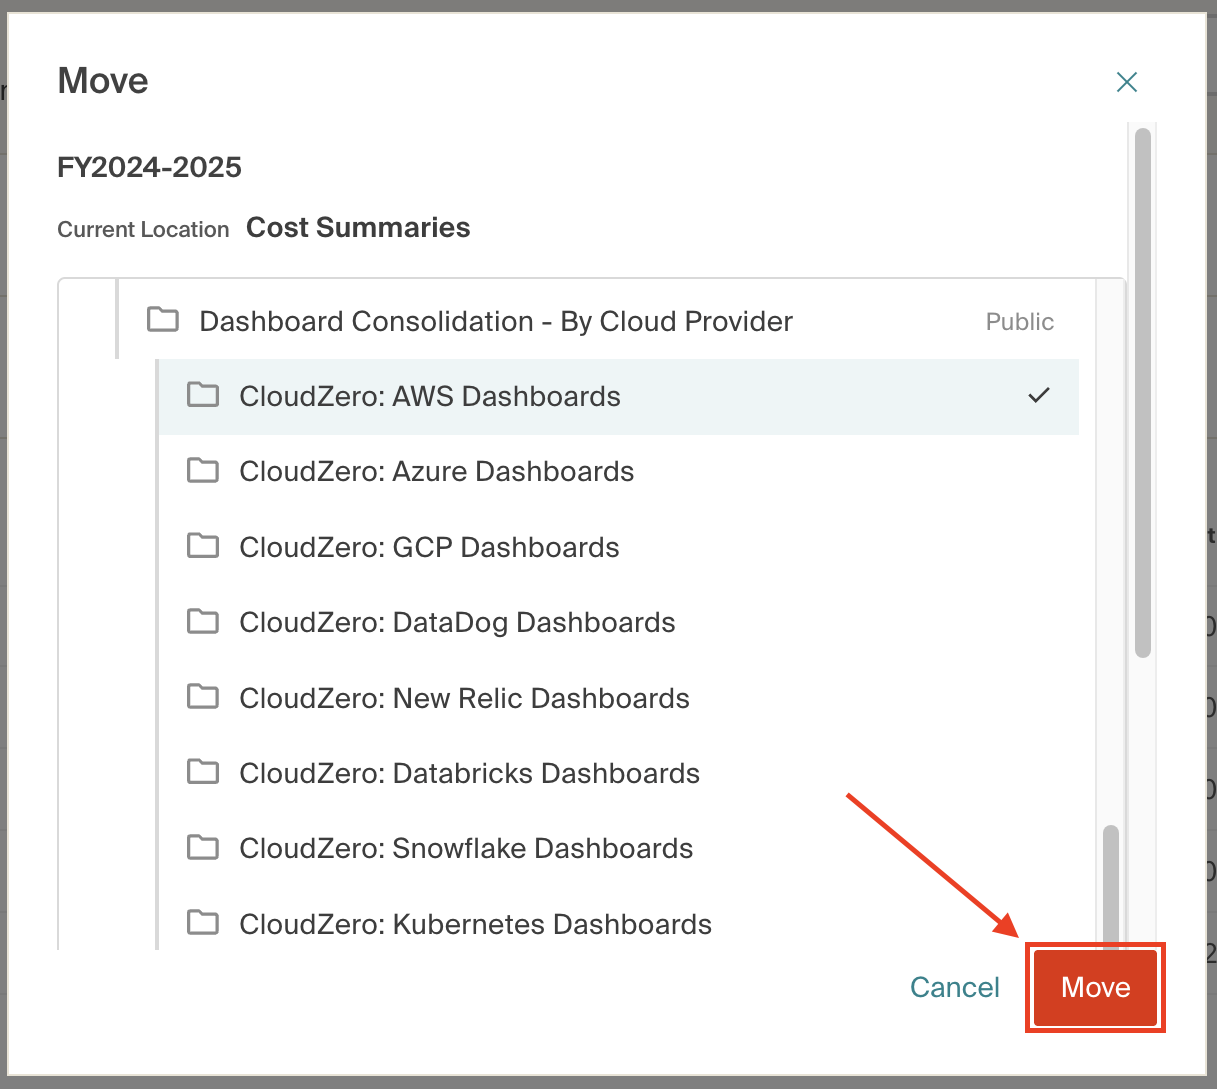
Move a folder or Dashboard
You can move Dashboards and folders. Moving a folder also moves all of its nested contents.
-
On the Analytics page, locate the item and click the ... menu in the Actions column.
-
Select Move.
-
Select a destination folder and select Move.
Dashboard performance tips
Follow these guidelines to keep Dashboards fast and usable:
- Limit the date range in your default filter to only the months you need. Less data means faster load times.
- Limit the number of tiles. Each tile adds queries and memory consumption.
- Minimize pivot tables. They consume more memory and produce more complex queries.
- Use tables instead of individual tiles for summary-level data. This reduces the number of queries.
- Limit rows and columns in visualizations. Fewer rows and columns improve both readability and load time.
Have questions or feedback? Reach out to your account manager.
Updated 2 months ago