Overview
The Overview tab shows how much you could save and how much you have saved. It gives you a high-level picture of your optimization progress so you can see where savings are available and track the impact of recommendations you have already addressed.
In CloudZero, select Optimize from the left navigation. The Overview tab is selected by default.
What the Overview tab shows
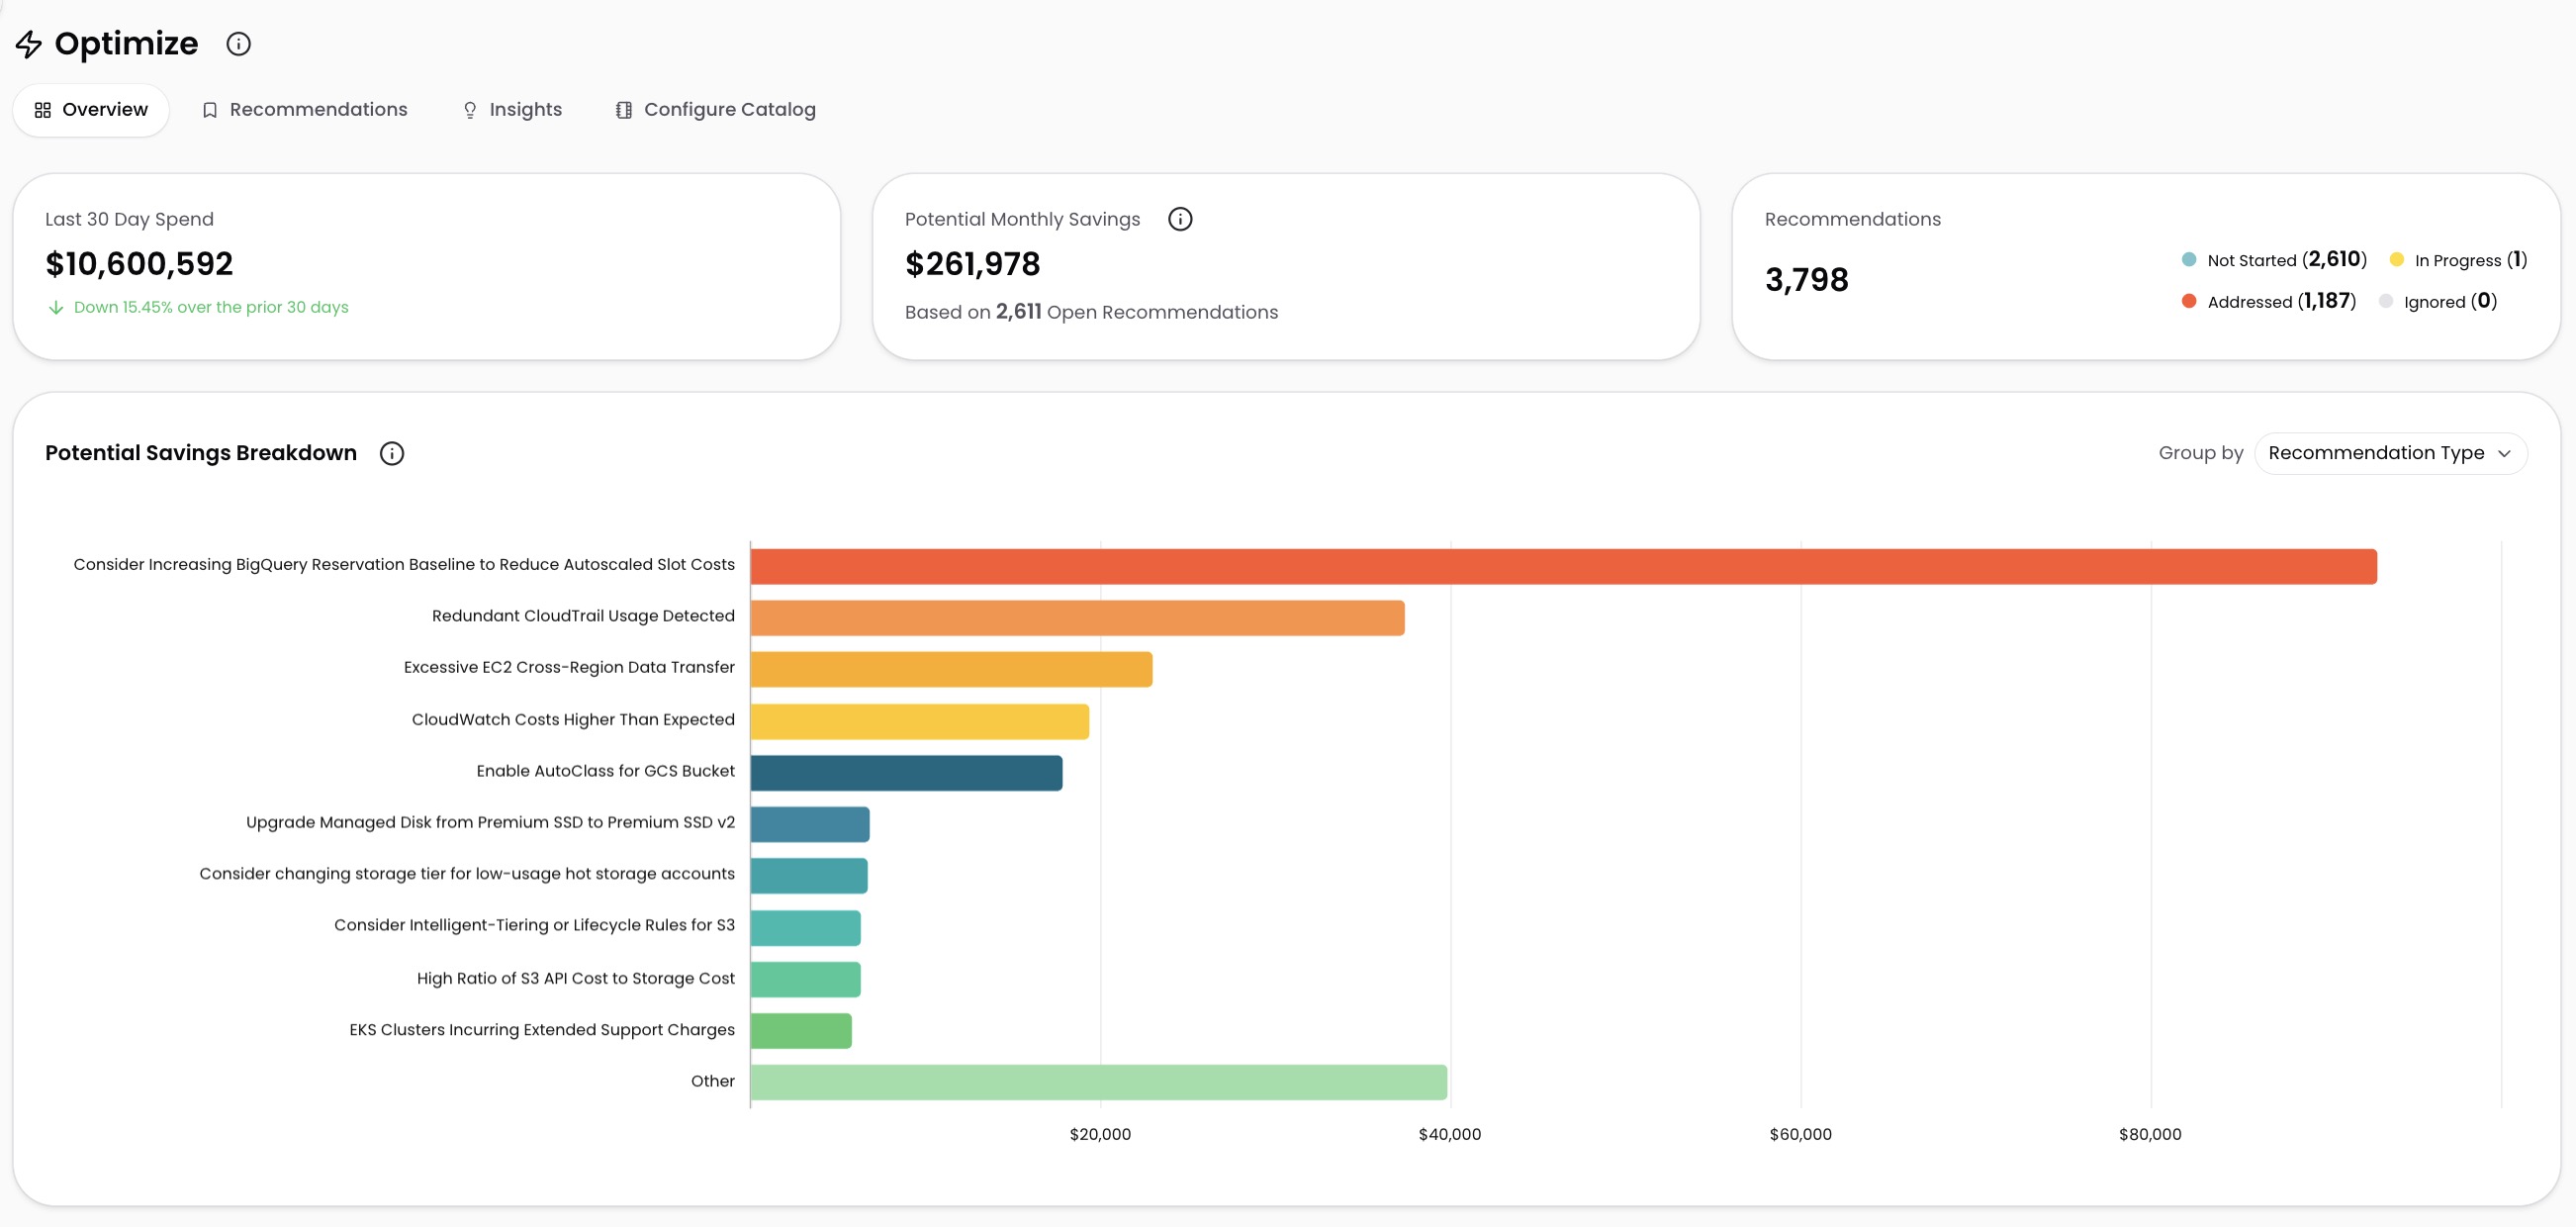
The Overview tab displays four summary metrics:
- Total Spend: Your total cloud spend over the past 30 days across all connected providers.
- Potential Savings: The total estimated monthly savings from all open recommendations.
- Open Recommendations: The number of recommendations with a status of Not Started or In Progress.
- Realized Savings: The total savings from recommendations you have addressed. See Realized savings for how this is measured.
Below the summary metrics, a visualization shows your open recommendations. You can group this visualization by Dimension to see how recommendations and potential savings break down across your organization.
Group by Dimension
Grouping lets you see how recommendations and potential savings break down by team, product, account, or any other category your organization has defined. For example, group by Team to see which teams have the most open recommendations, or by Account to compare potential savings across cloud accounts.
To group recommendations:
- Select the Group By selector at the top of the Overview tab.
- Choose a Dimension (Account, Region, Service, or any custom Dimension your organization has defined, such as Team or Product).
- The visualization updates to show recommendations and potential savings for each value in the selected Dimension.
The recommendations and savings you see depend on your role and data access filters. If your role has access to a single account, only data for that account is shown.
Realized savings
Realized savings measures the actual cost reduction from recommendations you have addressed. When you mark a recommendation as Addressed (or CloudZero detects the change automatically), CloudZero begins comparing the resource's cost before and after the change to measure the impact. CloudZero recalculates realized savings daily.
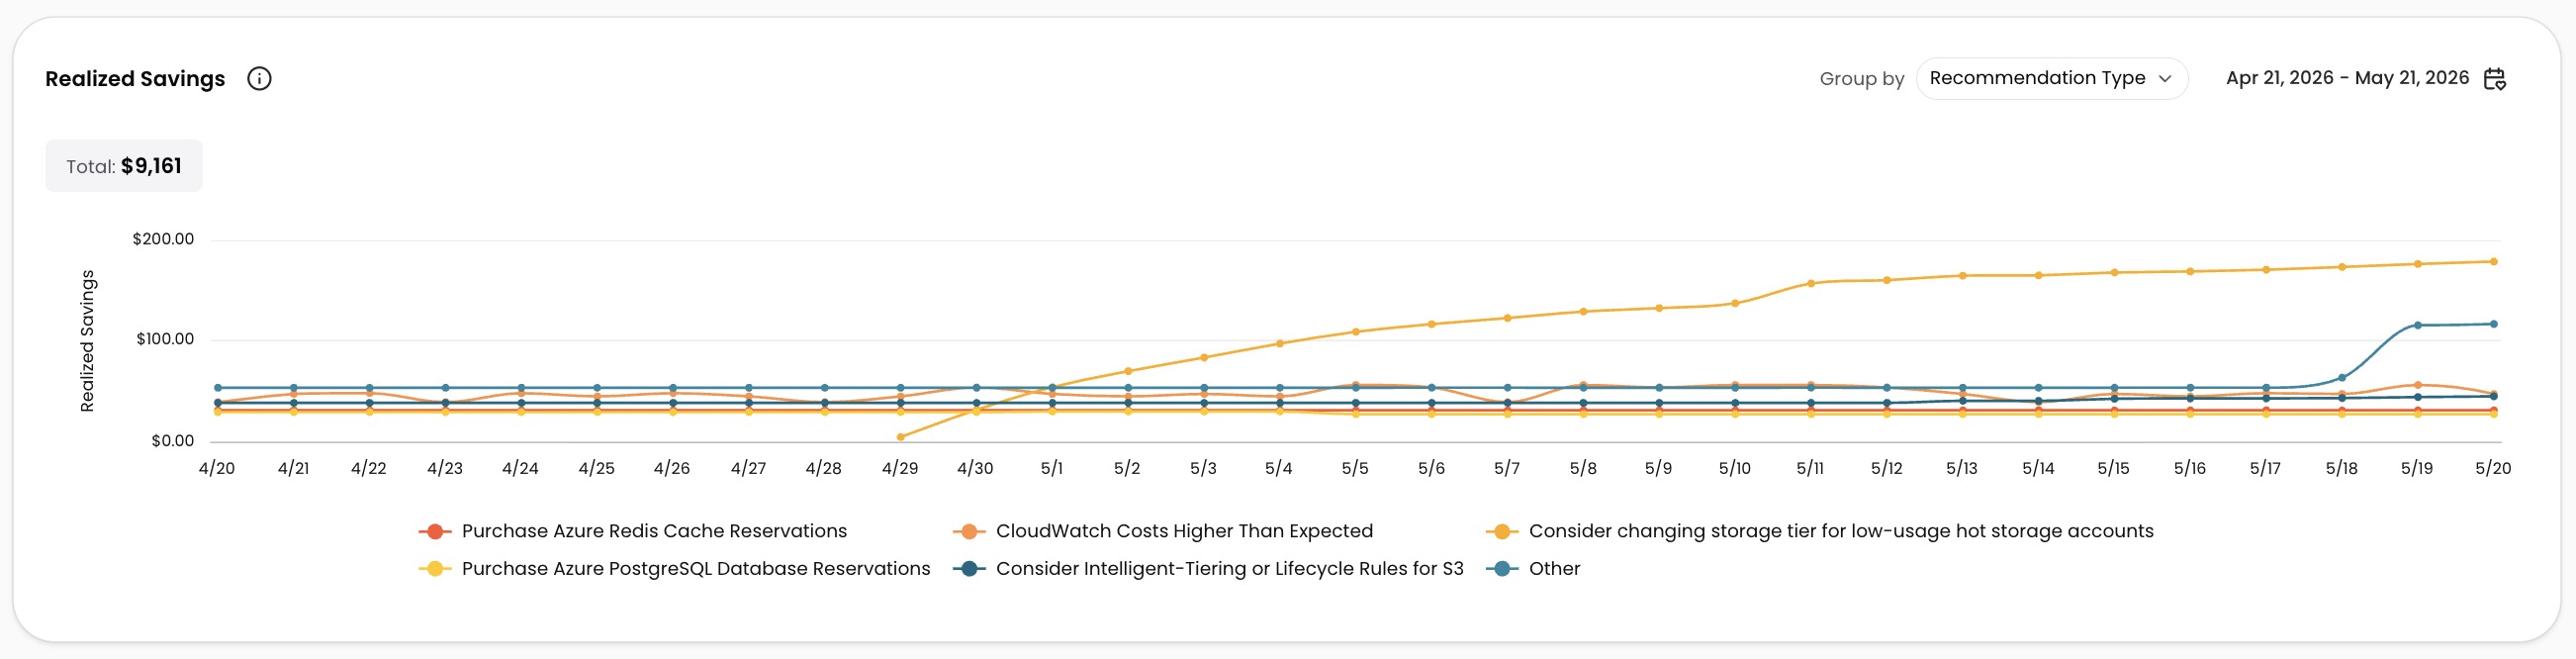
View realized savings
- Scroll to the Realized Savings block on the Overview tab.
- Select the date picker to choose a time range.
- To break down savings by Dimension (for example, account or service), choose a Dimension from the Group By selector.
How realized savings are calculated
CloudZero calculates realized savings by comparing the initial 30-day cost impact of a resource against its current 30-day cost impact. The difference is divided by the number of days since the recommendation was addressed (up to 30 days) to determine the average daily savings.
Example: A resource has an initial daily cost impact of $100 ($3,000 over 30 days). After addressing the recommendation, the cost impact drops to $0:
| Days since addressed | Current 30-day cost impact | Daily realized savings |
|---|---|---|
| 0 | $3,000 | $0 (no change measured yet) |
| 1 | $2,900 | $100 |
| 5 | $2,500 | $100 |
| 10 | $2,000 | $100 |
| 30 | $0 | $100 |
| 100 | $0 | $100 (capped at 30-day window) |
After 30 days, CloudZero uses the full 30-day window for comparison. The daily realized savings stabilizes once the resource's cost impact has fully reflected the change.
Have questions or feedback? Reach out to your account manager.
Updated about 1 month ago