Explorer Overview
Explorer brings together spend from services such as AWS, Azure, GCP, Kubernetes, AI services, observability tools, and virtually any other cloud or SaaS provider into one interactive visualization. Group costs by team, product, service, environment, customer, or any category your business cares about. Drill down from a total monthly spend to a single resource in a few clicks. Whether you are monitoring a trend, investigating a spike, or answering a question from leadership, Explorer is where you start.
Your costs at a glance: the cost graph and table
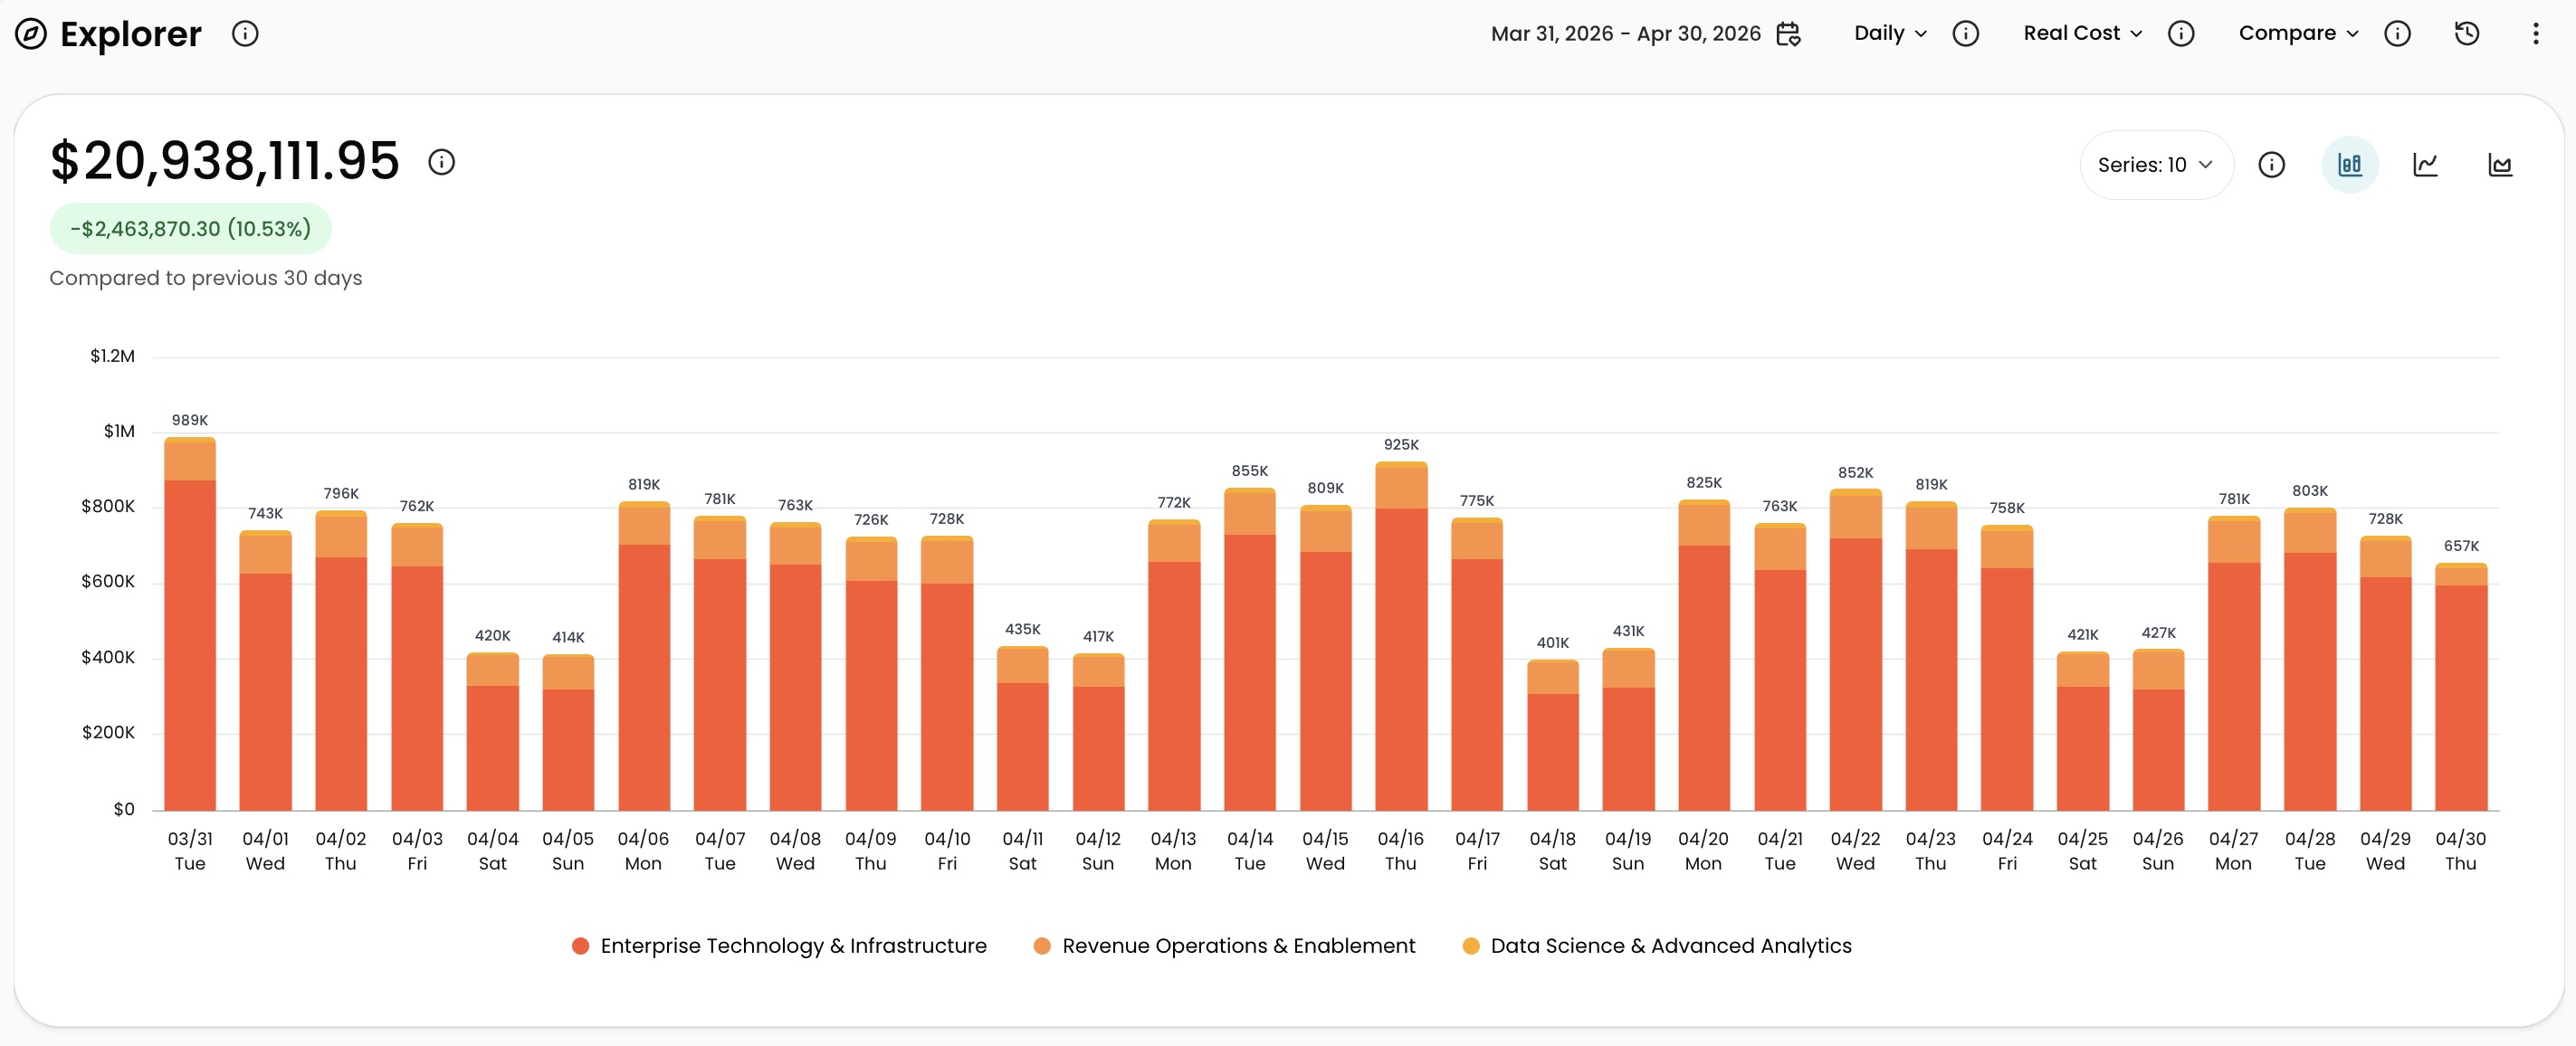
The cost graph shows what you are spending and whether it is going up or down:
- Total Cost: your spend for the selected period and applied filters
- Cost of Change: the increase or decrease compared to the previous period of the same length
Below the graph, the cost table ranks your spend by the selected Dimension. The table loads an initial 100 rows; select Load More to view additional results. Click any row to drill deeper, or click any column header to re-sort. Toggle Cost of Change comparisons on or off with Cost Trends. You can also customize which columns appear and how the table is laid out.
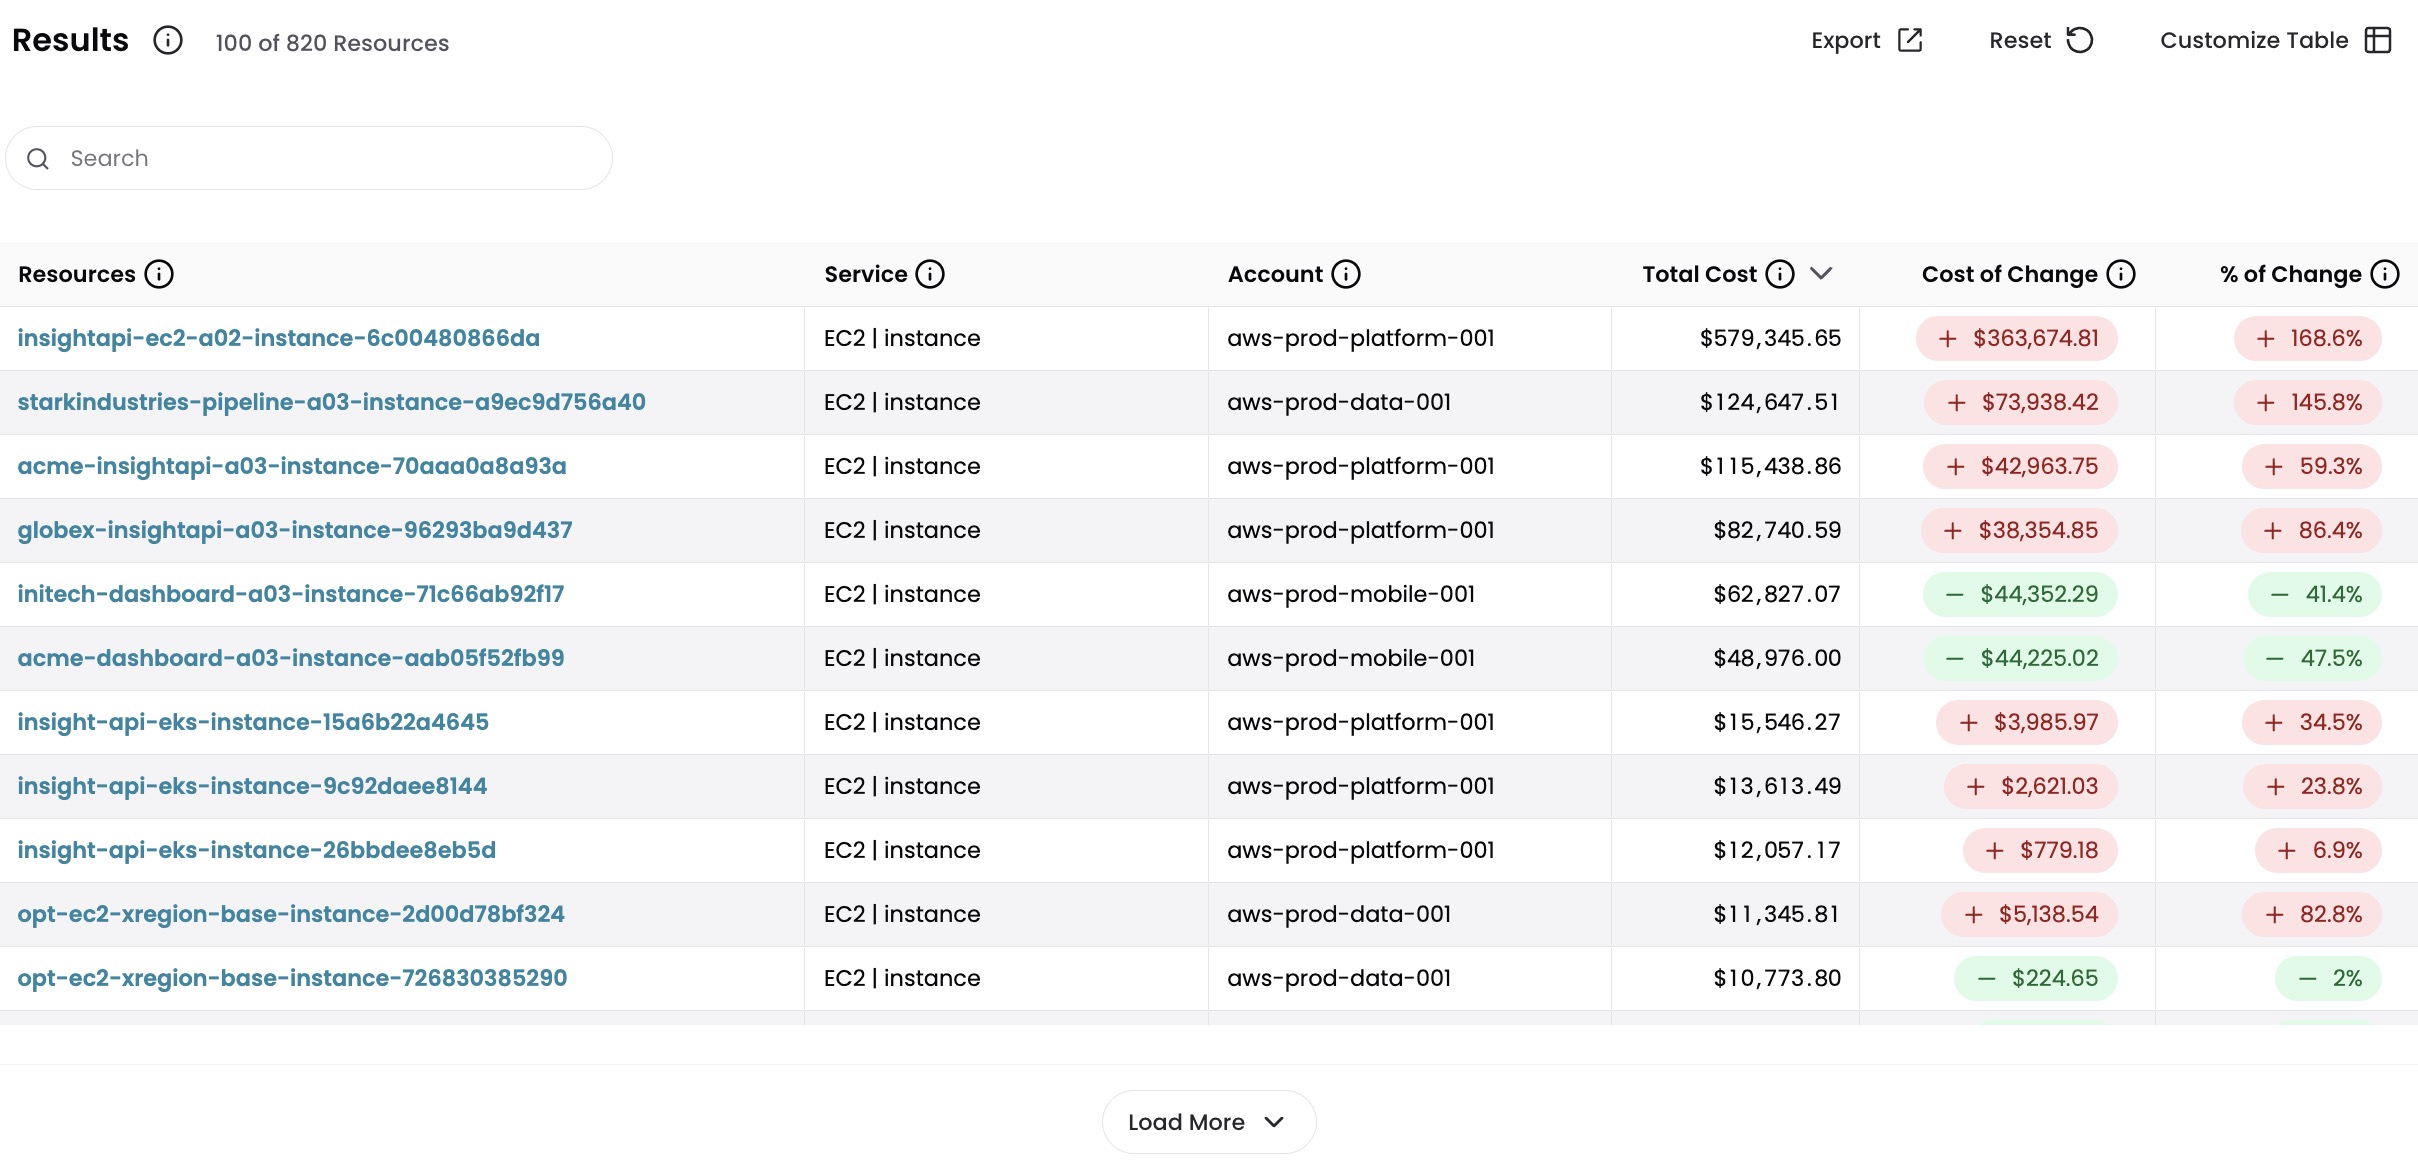
Explorer shows 100% of your cloud spend across all connected providers. Any spend not allocated to a value in the selected Dimension appears under Not In Dimension, so nothing is hidden or unaccounted for.
Organize, filter, and compare
Three controls shape what you see:
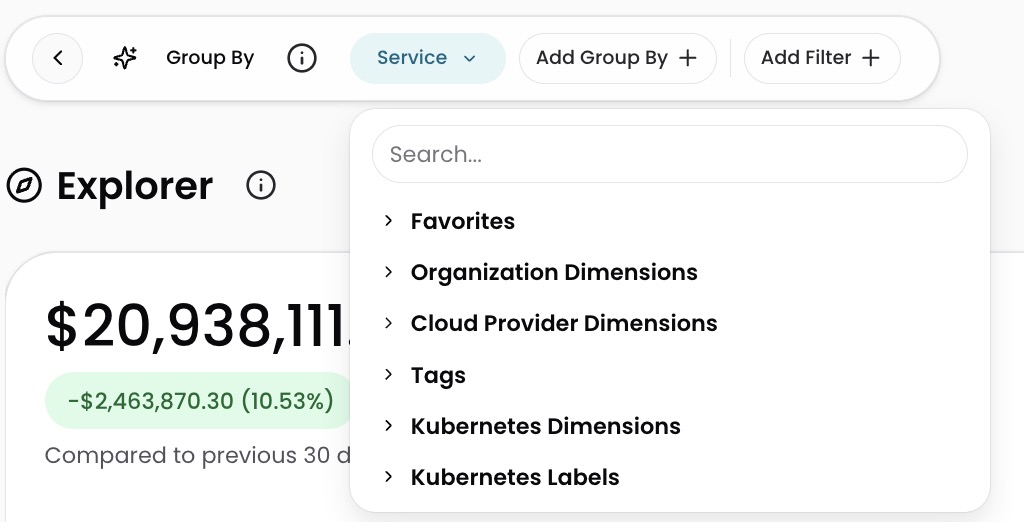
- Group By organizes costs by any Dimension, so you see spend the way your business thinks about it (by team, product, or customer) rather than the way your cloud provider bills it
- Filters narrow to specific costs, for example, a single team's spend on a single service
- Time Range sets the period to analyze, from the last 24 hours to the last 12 months
You can also group by two dimensions at once, save queries as favorites, switch between bar, line, and stacked chart views, and compare spend across time periods. For full details on each control, see Grouping, Filtering, and Time Range.
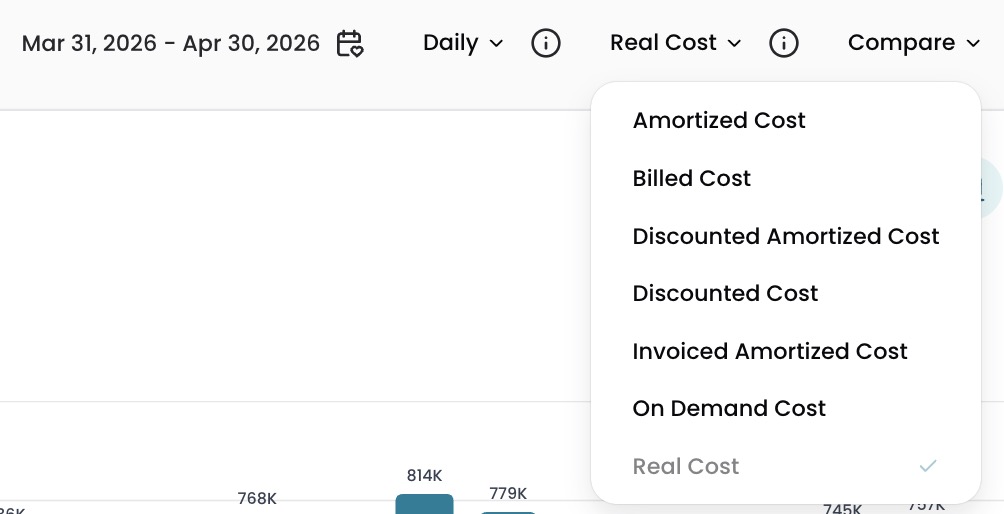
See costs from different angles with Cost Types
The numbers in Explorer depend on which Cost Type is selected. Switch between what you were invoiced, what your team consumed, or what you would have paid at on-demand rates. The default is Real Cost.
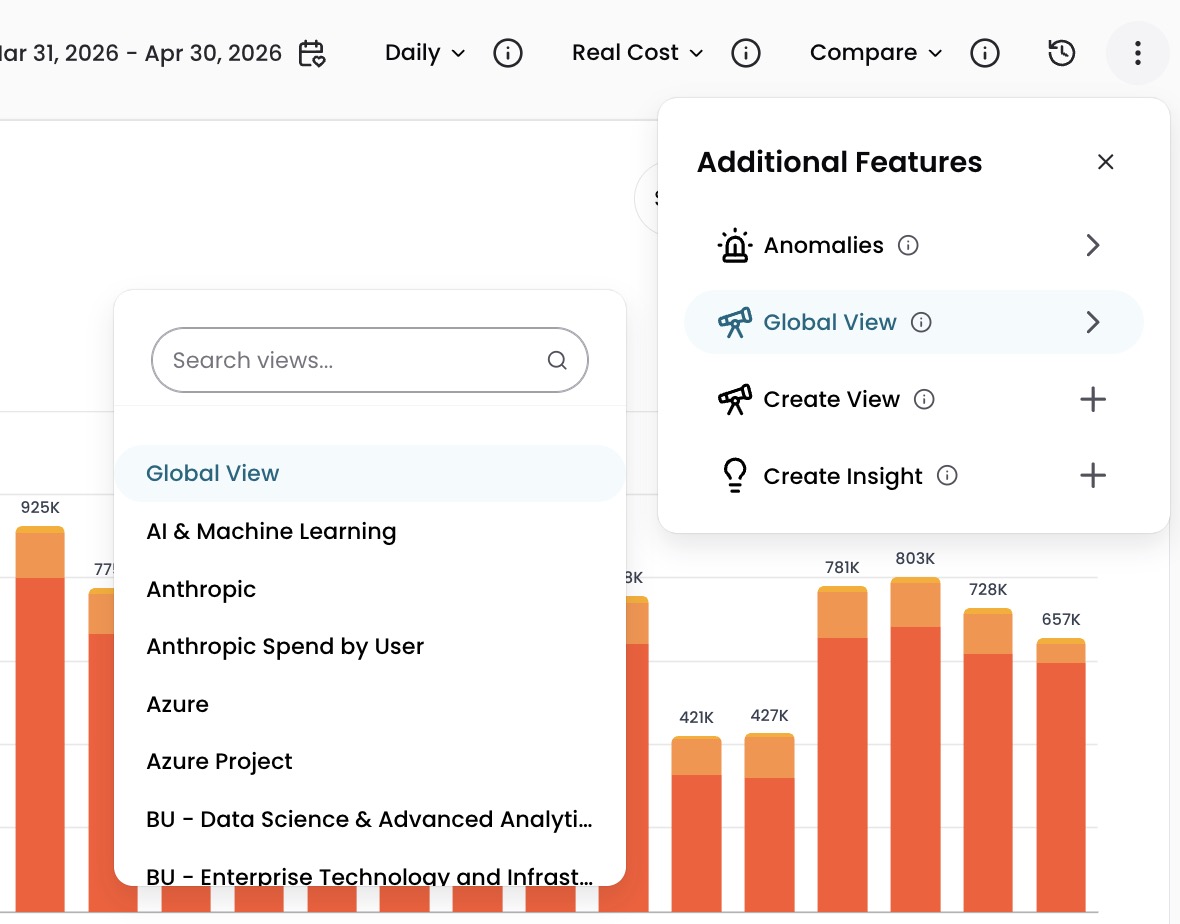
Give every team their own cost view with Views
Views combine a grouping, filters, and notification channels into a single preset, giving each team ownership of the costs they are responsible for. Each View monitors its scope for cost changes and sends updates and anomaly alerts to the configured Slack channel or email.
- An engineering lead gets their team's spend by service with alerts in their Slack channel
- A product manager gets costs by feature with a weekly email summary
- A finance team gets total spend across all providers with a monthly rollup
Choose a View from the Select a View dropdown in the top-right corner of Explorer.
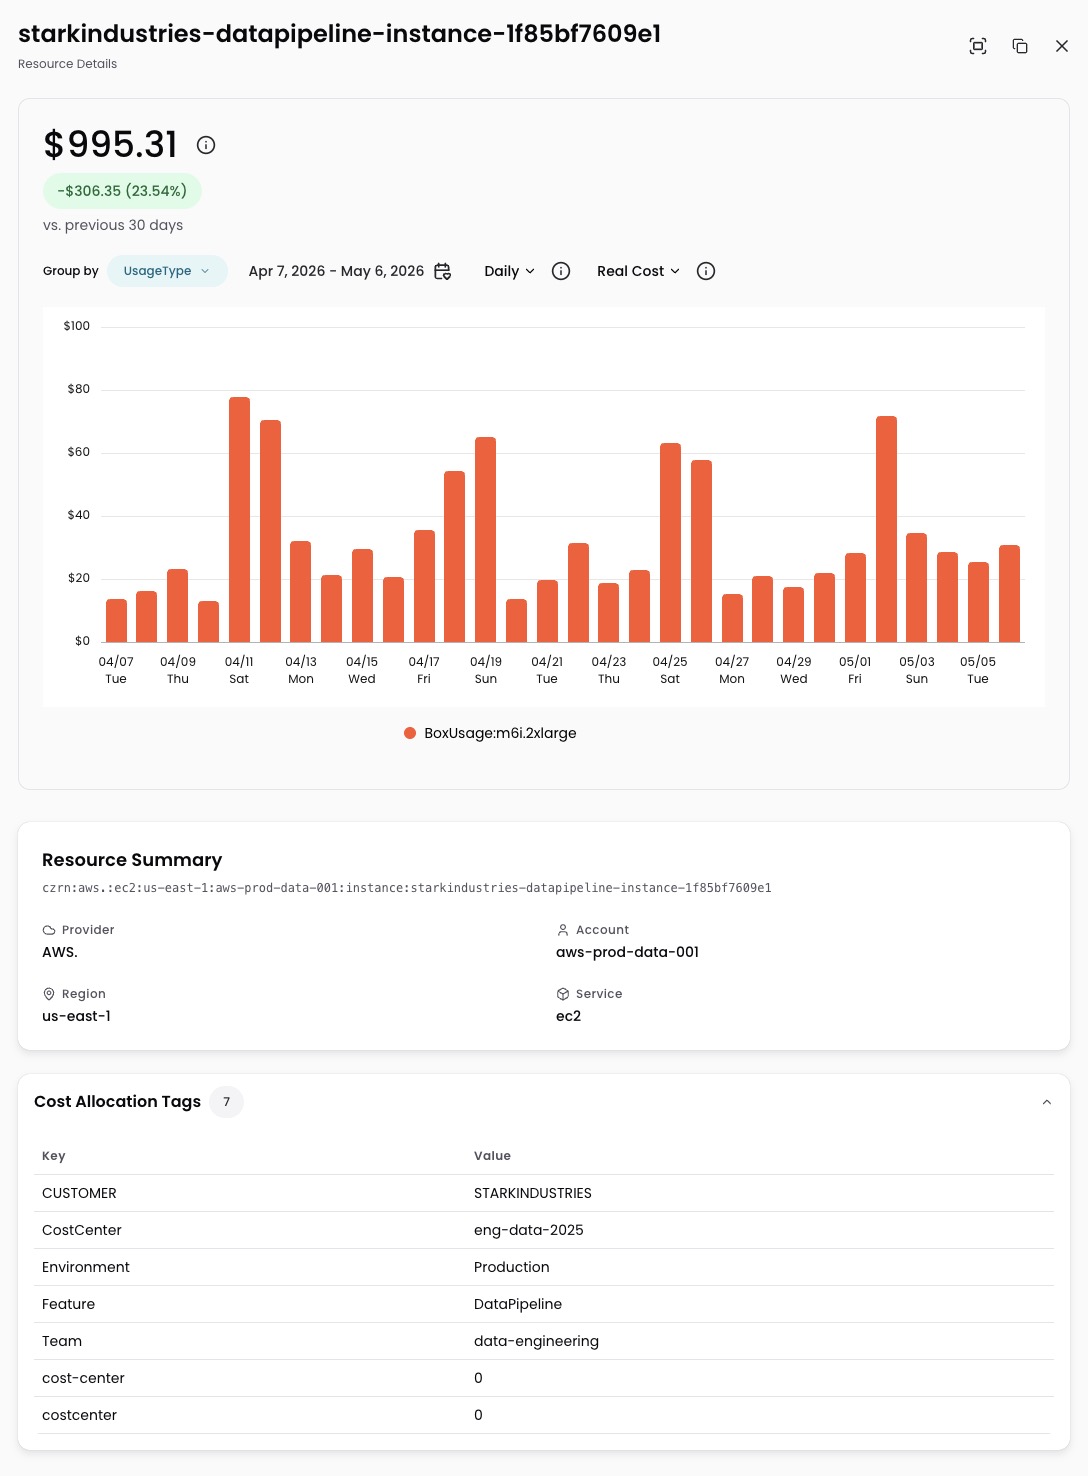
Drill down to any resource detail
Click through the cost table until you reach individual resources, then click a resource name to open its detail drawer:
- Cost over time for that specific resource
- Tags applied to the resource
- Properties such as instance type, storage class, and configuration
- Relationships with other resources
- Change history showing recent configuration changes
Act on what you find with Insights
When you find something worth acting on, you can log it as an Insight directly from Explorer. The Insight links back to the Explorer query where you discovered it, so anyone reviewing it later sees exactly what you saw. Insights are tracked in Optimize, giving your team one place to manage cost findings.
To create an Insight:
- Click the Configurations icon (sliders) in the top-right corner of Explorer.
- Select the Features tab.
- Select Create Insight.
- Enter the details for your Insight.
- Click Create Insight to save the finding.
For a description of each field, see Insight fields.
Putting it together: investigating a cost change
Explorer is built for investigation. When you see a cost spike or unexpected change:
- Group by Service to see which services are driving the change.
- Click a row to drill down. The table re-groups by a related Dimension.
- Pivot the Group By to see the same costs from a different angle.
- Add filters to narrow from multiple angles at once.
- Open resource detail to see tags, properties, and configuration.
- Create an Insight to log the finding and track it in Optimize.
Each step refines the data without losing context. You can also overlay anomalies and engineering events on the cost graph, or use the AI Hub to query your cost data conversationally.
Have questions or feedback? Reach out to your account manager.
Updated 5 days ago