Anomaly Detection
CloudZero automatically monitors your cloud spend and identifies unexpected cost changes down to an hourly granularity. Global anomaly detection starts the moment you connect, with no configuration required. CloudZero continuously analyzes your spending patterns and flags anomalies when actual costs deviate from expected trends.
You can also enable anomaly notifications for specific Views to alert your team through Slack or email when anomalies are detected in specific areas of your spend.
In CloudZero, select Anomalies from the left navigation.
How anomaly detection works
CloudZero detects anomalies at two levels:
- Global anomalies: CloudZero automatically monitors your total cloud spend across accounts, services, and usage families. Global anomaly detection is always on and requires no configuration. By default, all users with Admin permissions receive anomaly alerts by email, up to three times per day.
- Anomalies on a View: When you enable anomaly notifications for a View, CloudZero monitors the spend for that View's Principal Dimension and its individual elements. This lets you detect anomalies specific to a team, product, account, or any other category your organization has defined.
Cost impact
The cost impact of an anomaly is the difference between the expected cost (based on historical spending patterns) and the actual cost over the anomaly period.
What the Anomalies page shows
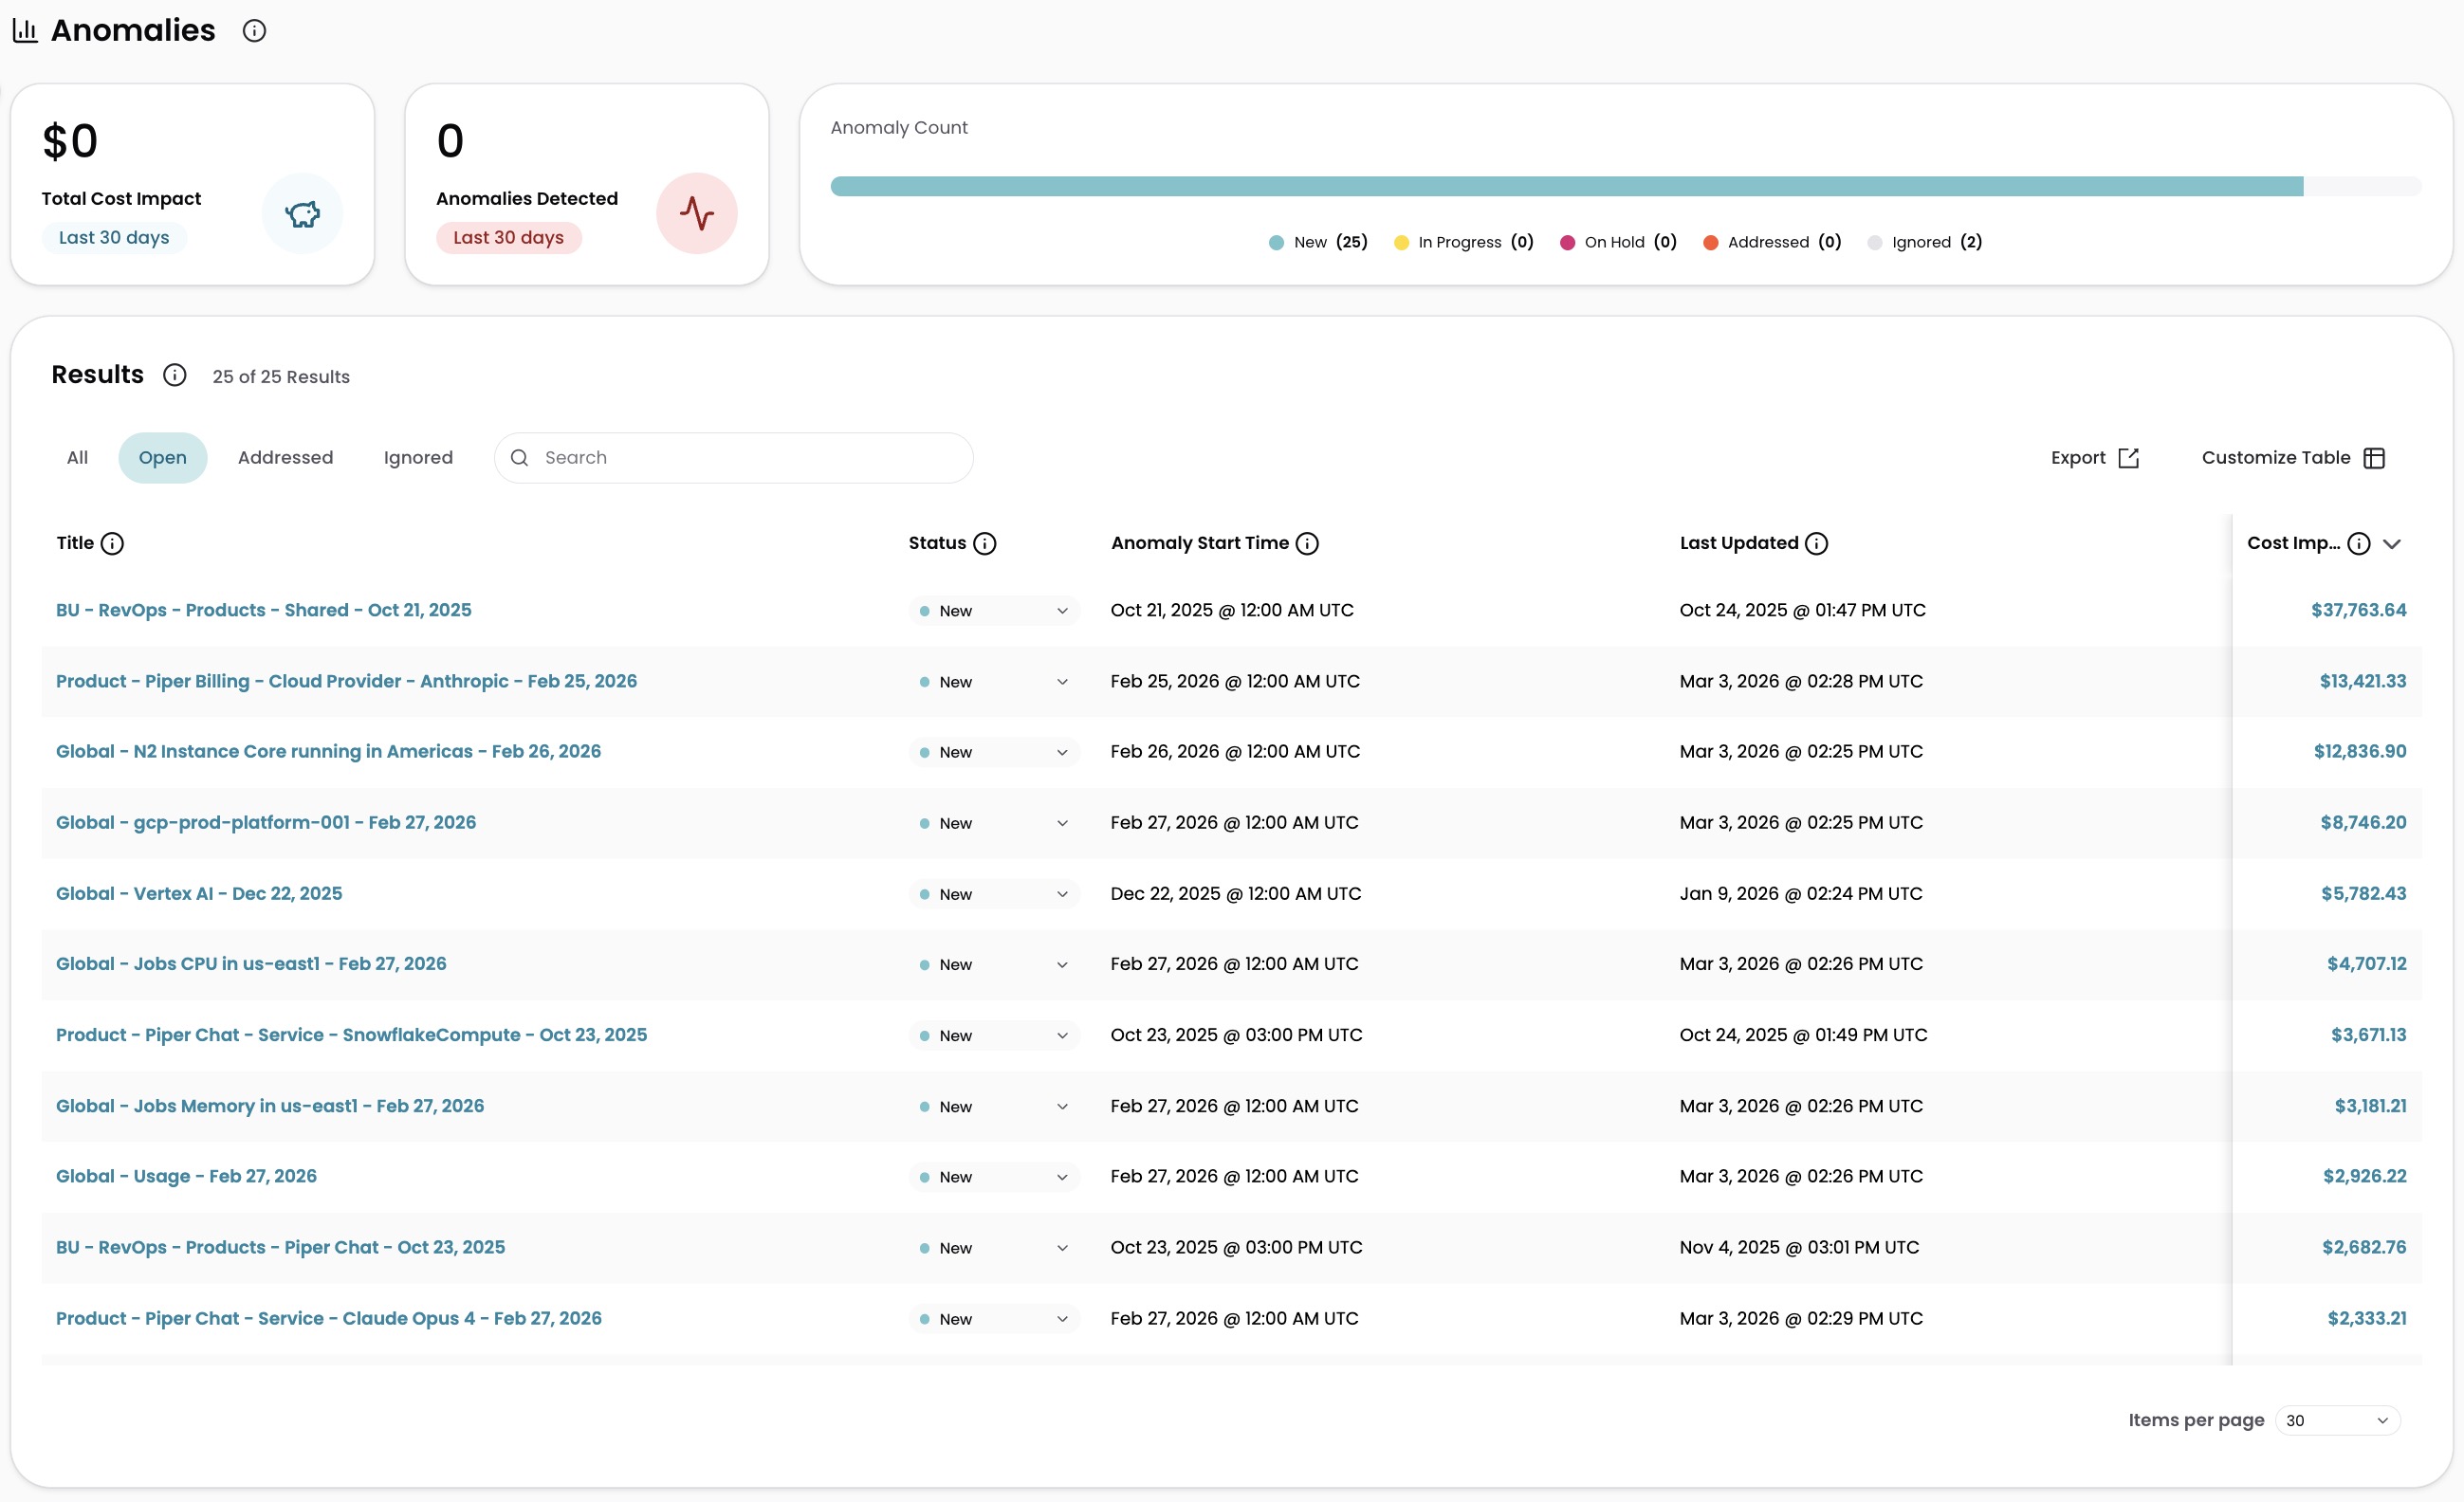
The Anomalies page gives you a complete picture of all detected anomalies across your environment.
- Total Cost Impact: The combined cost impact of anomalies detected in the last 30 days.
- Anomalies Detected: The number of anomalies detected in the last 30 days.
- Anomaly Count: A visualization showing how many anomalies are in each status (New, In Progress, On Hold, Addressed, Ignored), so you can see where your team's attention is needed.
Below the summary, a results table lists all anomalies with their title, status, anomaly start time, last updated date, and cost impact.
Find anomalies
The results table includes controls to help you find specific anomalies.
Search
Type in the search field above the table to find anomalies by title or other properties.
Quick filters
Quick filters above the table let you switch between anomaly states with one click:
| Quick filter | Shows |
|---|---|
| All | All anomalies regardless of status |
| Open | Anomalies with a status of New, In Progress, or On Hold |
| Addressed | Anomalies marked as Addressed |
| Ignored | Anomalies marked as Ignored |
You can also export the table, reset filters, and customize which columns appear using the controls above the table.
View anomaly details
Click an anomaly title to open the detail panel. The detail panel gives you the full context of the anomaly and lets you investigate and take action.
Overview tab
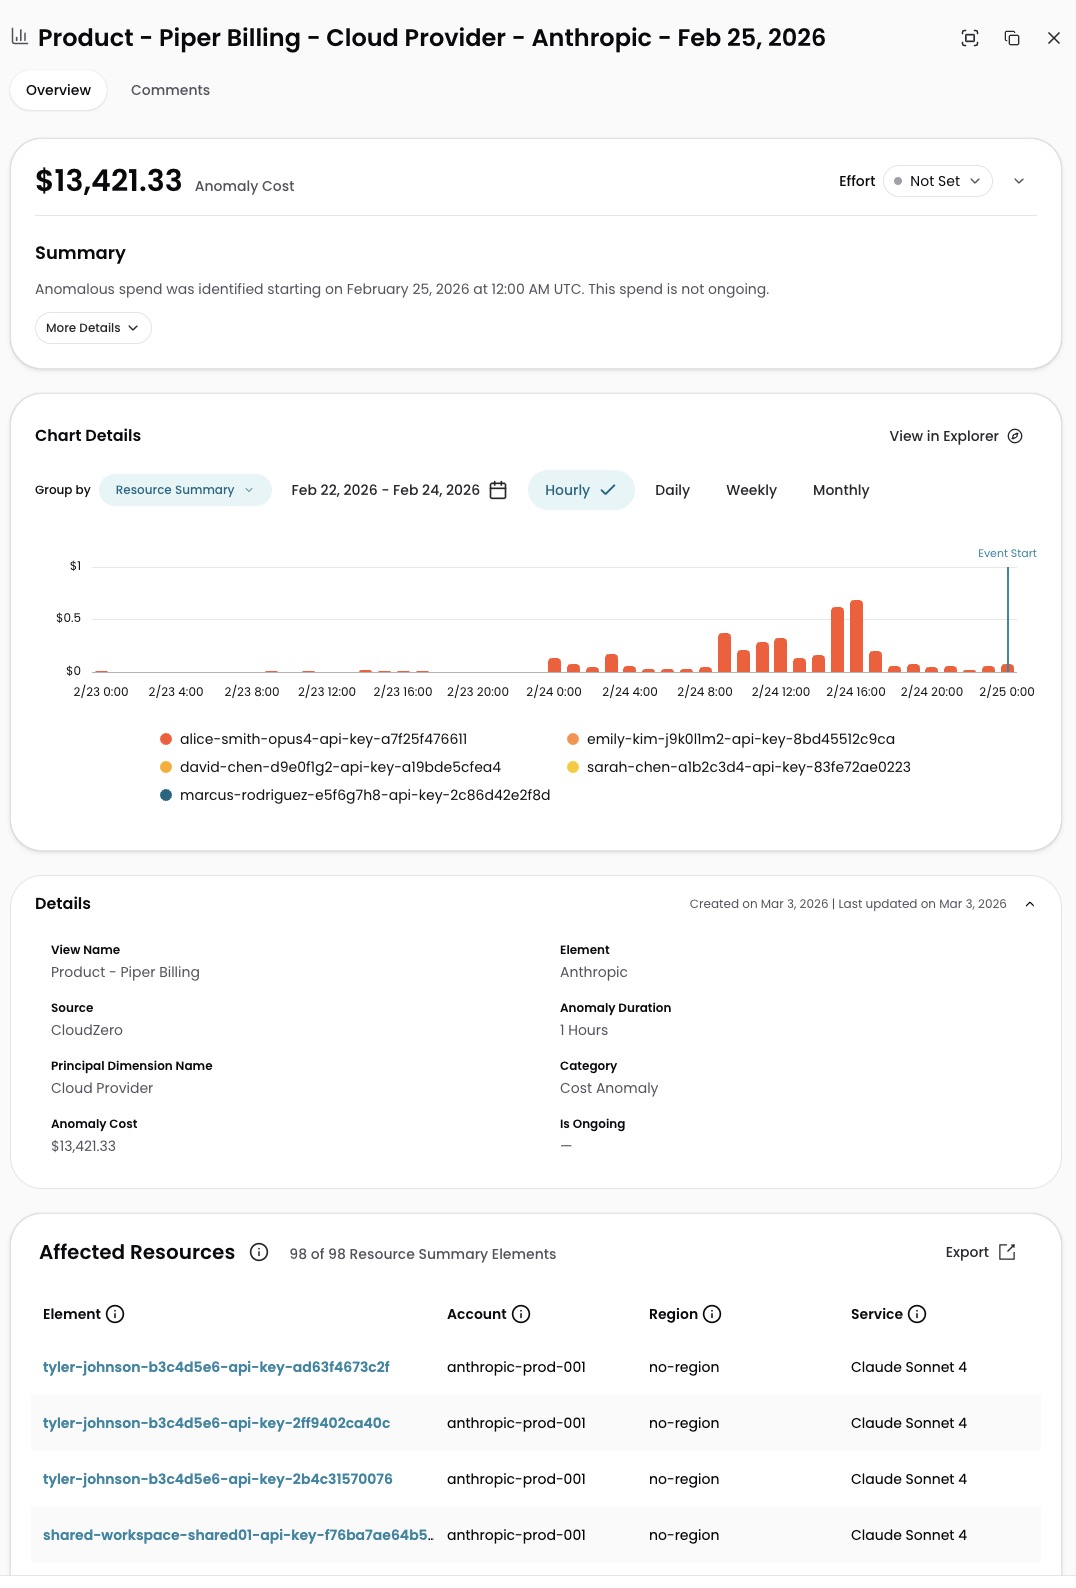
The Overview tab shows the complete picture of the anomaly:
- Anomaly cost and effort level are displayed at the top of the panel.
- Summary: A description of when the anomalous spend was identified and whether it is ongoing. Select More Details to expand additional context.
- Chart Details: A cost chart showing spend around the time of the anomaly, with an Event Start marker indicating when the anomaly began. You can change the Group By, date range, and granularity (Hourly, Daily, Weekly, Monthly). Select View in Explorer to investigate the anomaly further.
- Details: The View name, element, source, anomaly duration, Principal Dimension, category, anomaly cost, whether the anomaly is ongoing, and timestamps for when the anomaly was created and last updated.
- Affected Resources: A paginated table of all resources involved in the anomaly, showing each resource's element name, account, region, and service. Click a resource to view its full resource details, including provider, tags, and the CloudZero resource identifier.
- Description: A summary of the anomaly with a copy button.
Comments tab
The Comments tab provides a comment thread for team discussion. Add a comment and click Post to share it with your team.
Actions
From the detail panel, you can:
- Change status: Use the Status dropdown at the bottom of the panel.
- Create a work item: Select Create Work Item at the bottom of the panel to create a linked Jira ticket for tracking. Requires the Jira integration.
- Expand: Open the detail panel in full screen.
- Copy: Duplicate the anomaly.
Manage anomalies
You can update the status and effort level of any anomaly directly from the results table by clicking the dropdown in the Status or Effort column, or from the detail panel.
Anomaly statuses
Anomalies move through statuses as your team investigates and resolves them:
- New: The anomaly has been detected but no action has been taken.
- In Progress: Someone is actively investigating the anomaly.
- On Hold: Investigation is paused.
- Addressed: The anomaly has been resolved.
- Ignored: The anomaly has been reviewed and dismissed.
Anomalies in Explorer
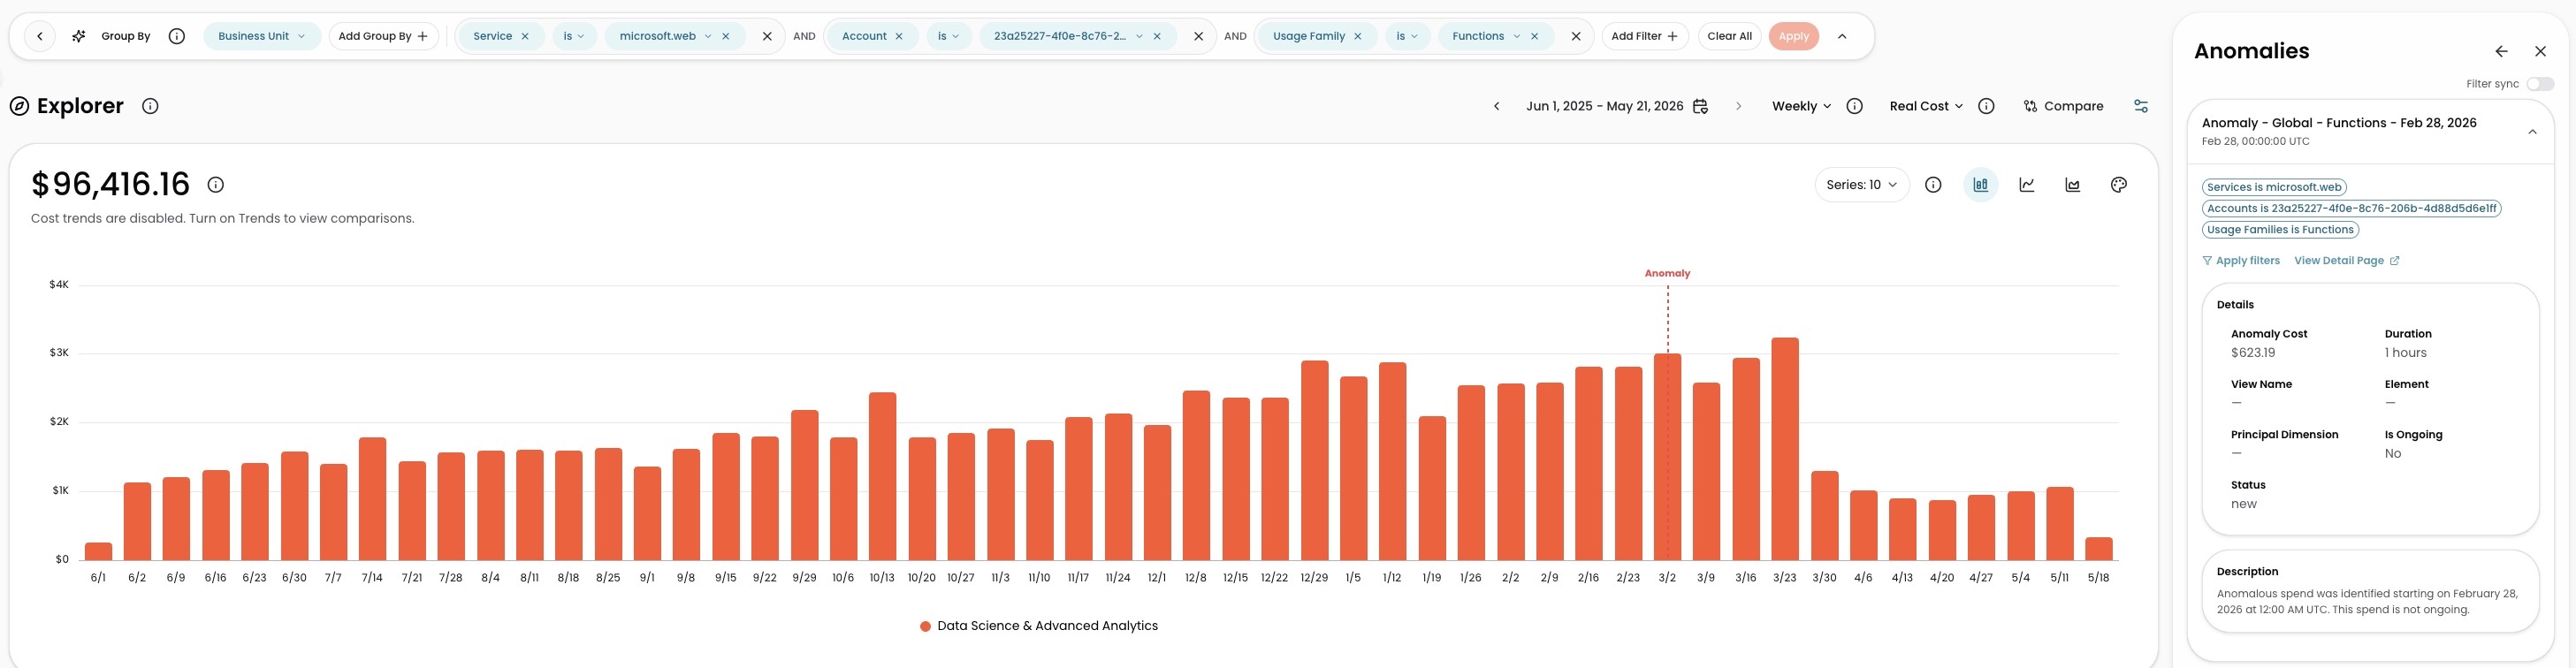
You can view anomalies in context in Explorer. Select View in Explorer from an anomaly's detail panel to open Explorer with the anomaly's filters applied and the anomaly marked on the cost graph.
The Anomalies & Events panel opens on the right side of Explorer with three tabs:
- Anomalies: All detected anomalies for the current Explorer context.
- Events: Engineering events correlated with cost changes.
- All: Anomalies and events combined.
Each anomaly card in the panel shows:
- Anomaly cost and duration
- View name, element, and Principal Dimension
- Whether the anomaly is ongoing
- Status and description
From an anomaly card, you can:
- Apply filters: Apply the anomaly's filters to Explorer to see the relevant cost data.
- View Detail Page: Open the full anomaly detail panel.
Export
You can export anomalies to CSV using the Export button on the Anomalies page. Anomalies are also available through the API at the /v2/insights endpoint.
Have questions or feedback? Reach out to your account manager.
Updated 2 months ago