Grouping, Filtering, and Time Range
Explorer lets you answer any cost question: by team, by service, by provider, across any time range. Five settings shape your query: grouping, filters, time range, granularity, and cost type. The fastest way to set them is to describe what you want in plain English. Type "Show our OpenAI spend by team for the last 3 months" and Explorer configures everything in one step. You can also adjust each control individually using the sections below.
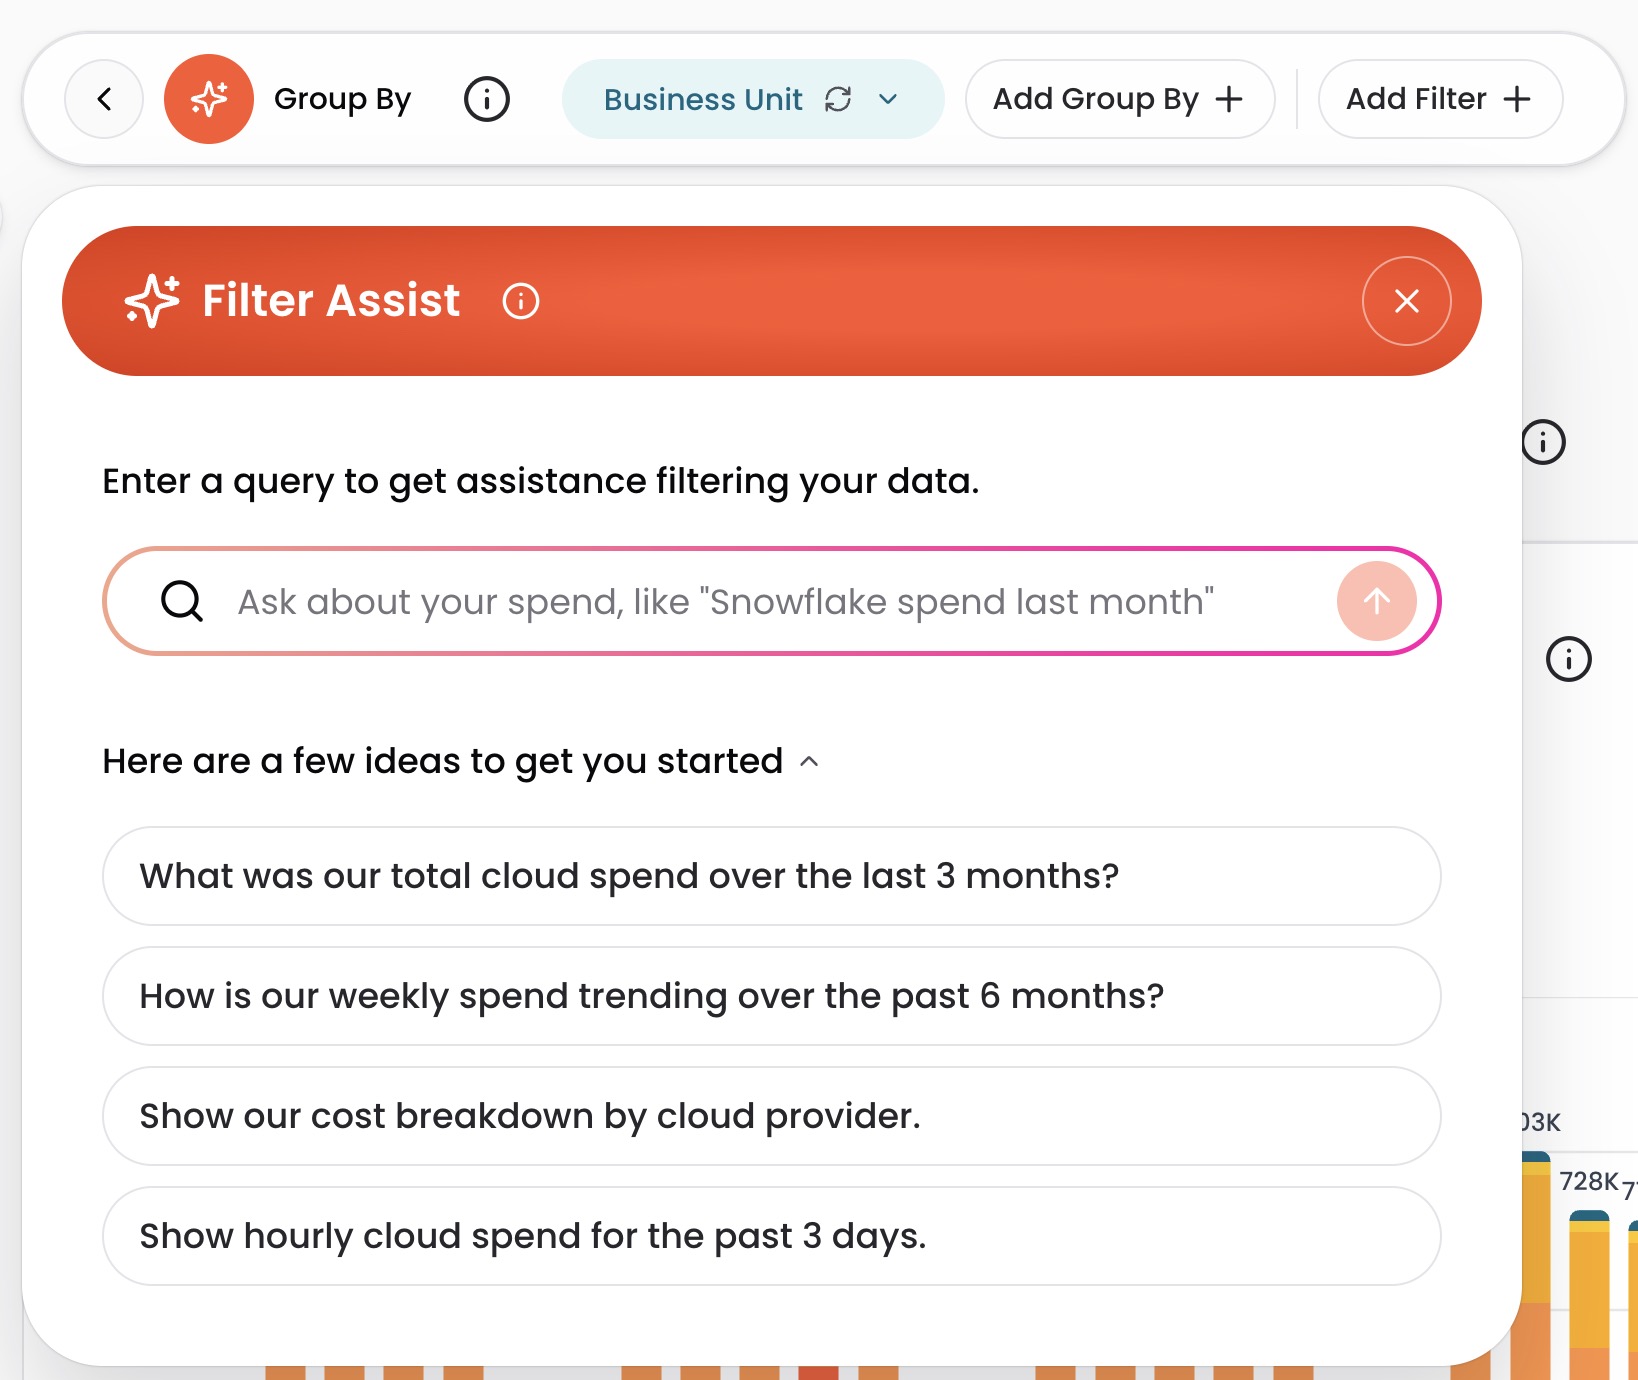
Build your query with AI using Filter Assist
Filter Assist uses AI to configure your Explorer query from a plain English question. No need to know which settings to change.
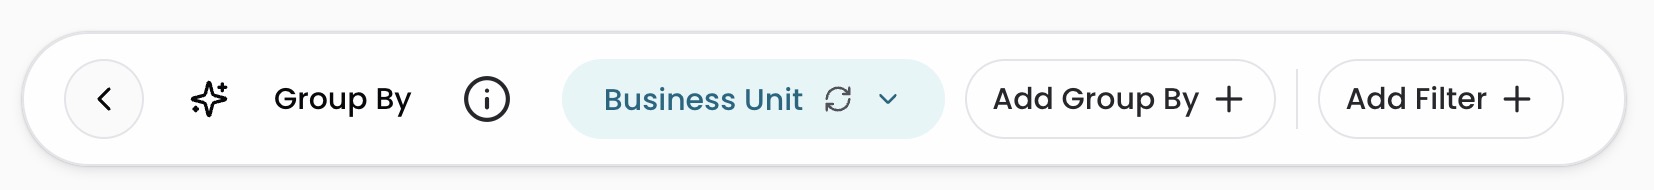
- Click the sparkle icon (✨) next to the expression builder.
- Enter your question in plain English, or click one of the suggested queries. Filter Assist applies the right grouping, filters, time range, granularity, and cost type based on your question.
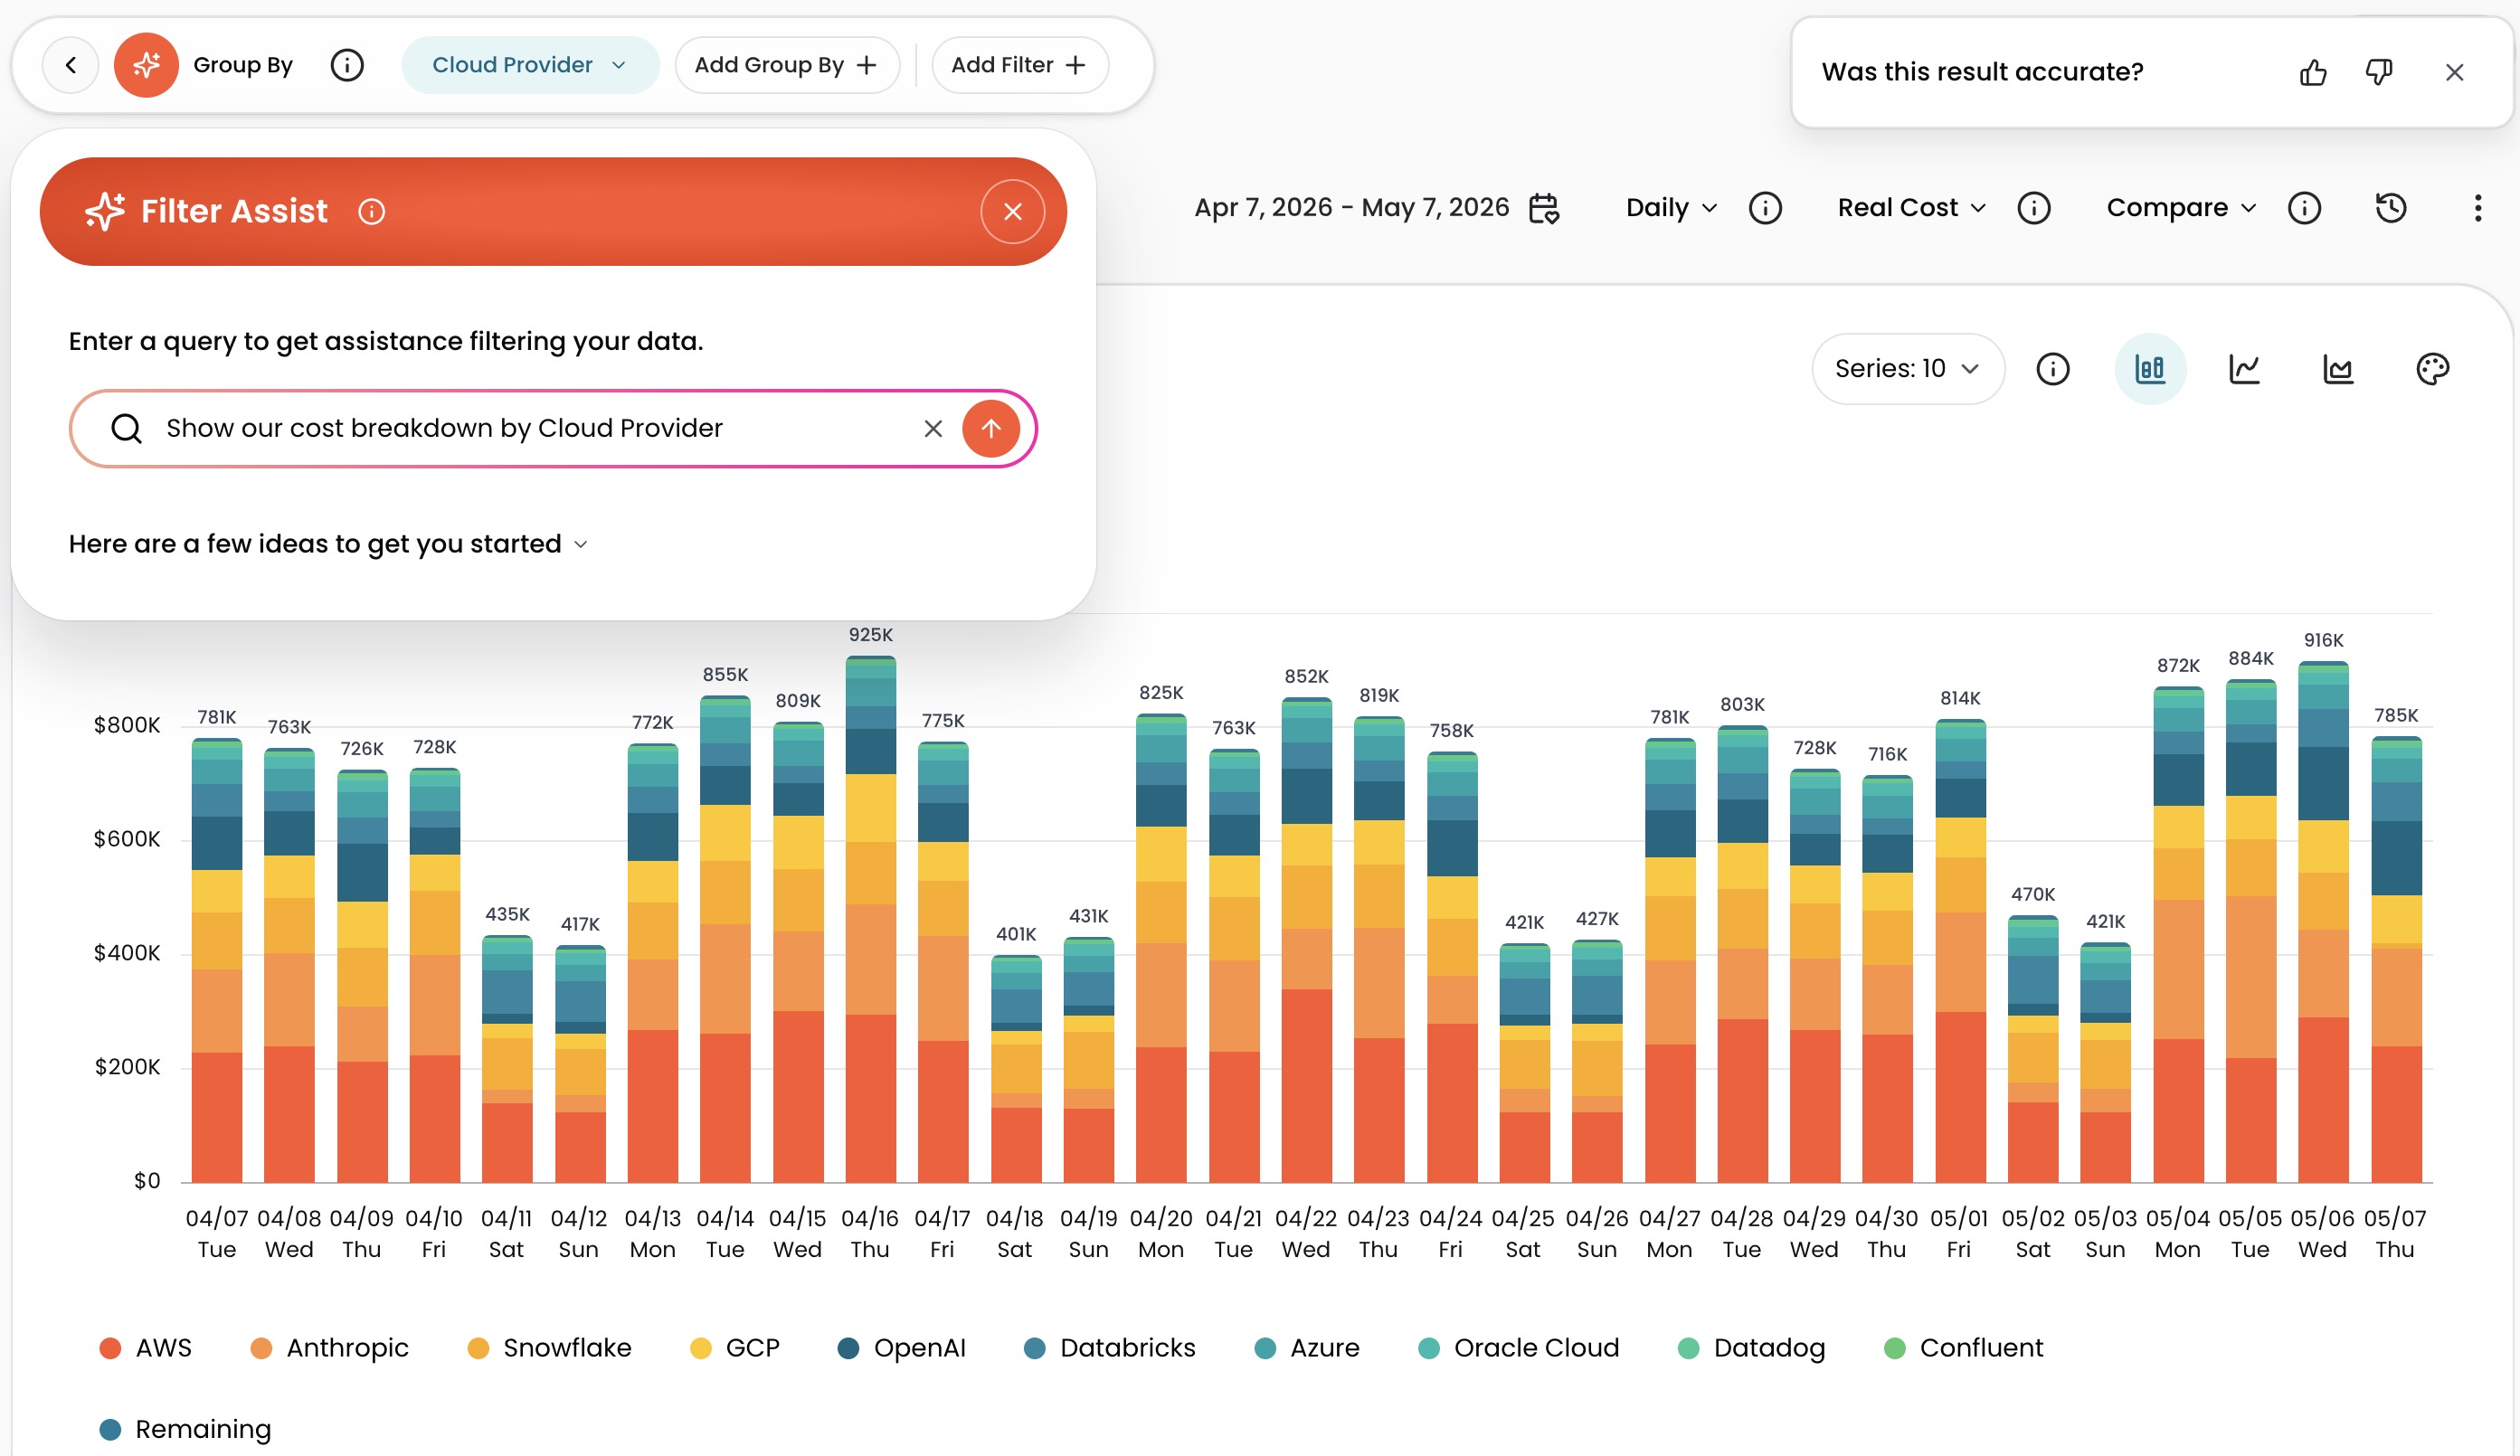
- Explorer updates instantly. Every setting Filter Assist applies is visible in the standard controls. Nothing is hidden.
- Fine-tune if needed. All applied settings are fully editable using the controls described in the following sections.
Example queries:
- "What was our total cloud spend over the last 3 months?"
- "Show our cost breakdown by cloud provider"
- "Show hourly cloud spend for the past 3 days"
- "What was the OpenAI spend for each AI Agent in November 2025?"
- "What Engineering Team spent the most money over the last 4 weeks?"
- "How is our weekly spend trending over the past 6 months?"
Tips for better results:
- Include time ranges in your query: "last 30 days," "past 3 months," "last week"
- Name Dimensions specifically: cloud provider, service, team, account
- Keep queries direct; one question per query works best
After each query, use the thumbs up/down prompt to share whether the result was accurate. Your feedback improves Filter Assist over time. For deeper analysis beyond query setup, use the AI Hub.
Side panel layout
Group By and filter controls appear at the top of Explorer by default. To move them into a dedicated left side panel, click the side panel icon next to the back arrow. To switch back, click the collapse icon at the top of the side panel. CloudZero remembers your choice across sessions.
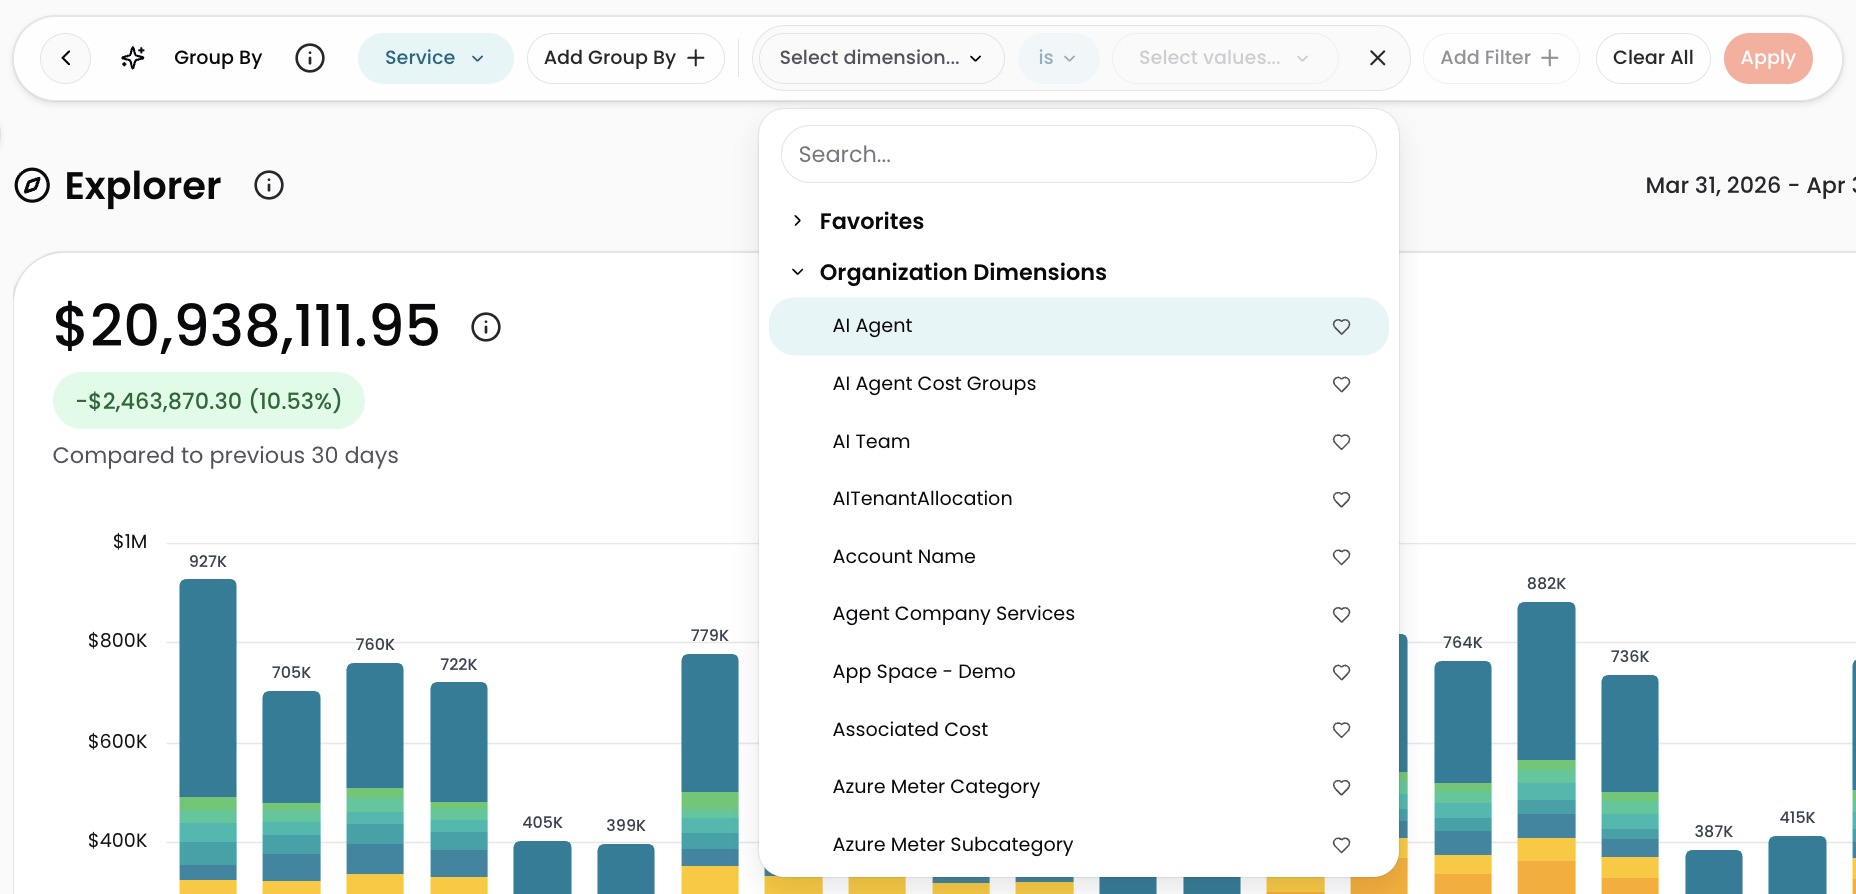
Group By
Group By organizes your costs by any category (Dimension) your business cares about.
To change the grouping, click the Group By selector at the top of Explorer and choose a Dimension. The graph and table update instantly. The total stays the same; only the breakdown changes.
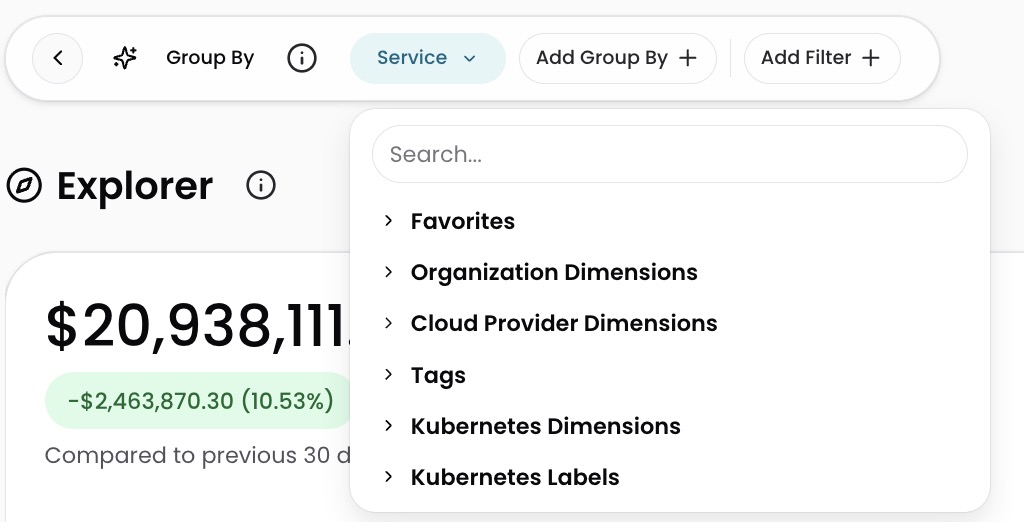
Available categories:
| Category | What it contains |
|---|---|
| Favorites | Dimensions you have marked with a heart icon |
| Organization Dimensions | Categories your organization defines (team, product, environment, customer) |
| Cloud Provider Dimensions | Account, service, region, instance type, AI usage, and more from your billing data |
| Tags | Tags applied to resources in your cloud provider accounts |
| Kubernetes Dimensions | Cluster, namespace, and workload (requires the CloudZero Agent) |
| Kubernetes Labels | Labels applied to Kubernetes resources (requires the CloudZero Agent) |
Explorer shows 100% of your cloud spend. Any spend not allocated to a value in the selected Dimension appears under Not In Dimension, so nothing is hidden.
Group by two dimensions
Sometimes a single Dimension doesn't answer the full question. "How much does each team spend?" is useful, but "how much does each team spend on each service?" is actionable. Adding a second Dimension nests one category inside another, so you can see how they interact.
To add a second Dimension, select Add Group By and choose a second Dimension.
For more on how Dimensions work, see Dimensions.
Filters
Filters narrow Explorer to a specific subset of your costs. For example, you can filter to one team, one service, one region, or any combination.
Click a row in the cost table to filter to that item and drill deeper. Keep clicking to reach individual resources.
Use the filter expression builder for more control:
- Select Add Filter + at the top of Explorer.
- Select a Dimension to filter on.
- Choose an operator and select values.
| Operator | What it does |
|---|---|
| is | Shows only the values you select (default) |
| is not | Hides the values you select |
| contains | Shows values that include your search term (case-sensitive) |
| does not contain | Hides values that include your search term (case-sensitive) |
- Continue to add more filters to narrow your results by repeating steps 1-3.
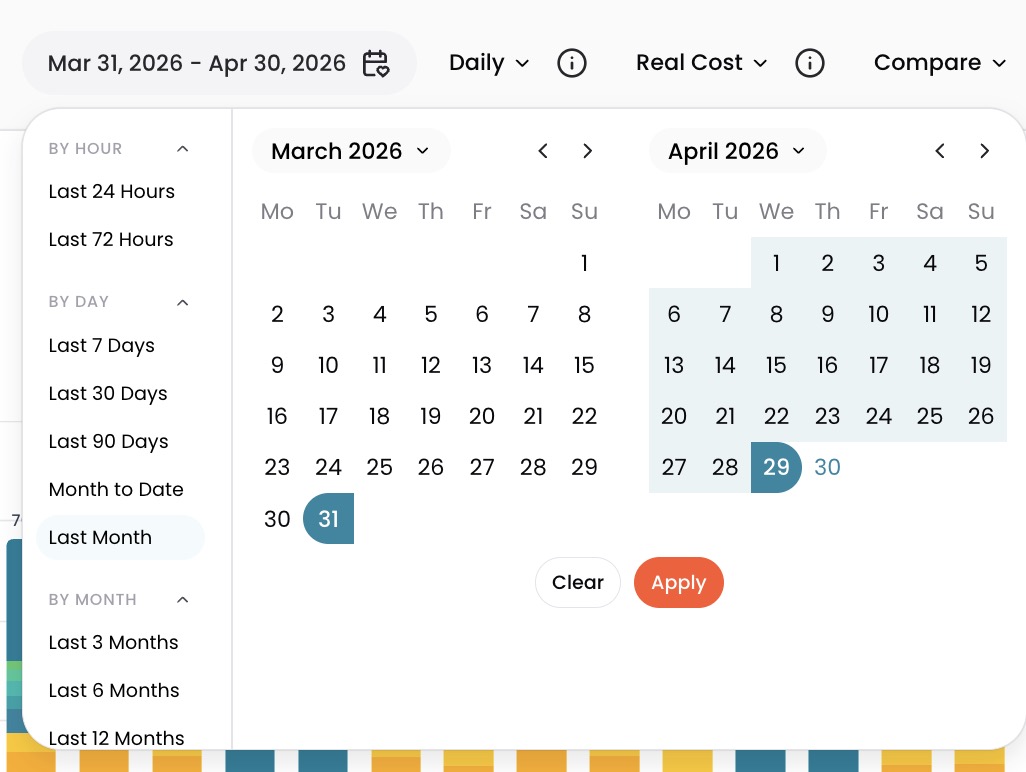
Time Range
Time Range sets which period of spend you are analyzing.
To change it, click the Time Range selector and choose a predefined range or set custom dates.
Granularity
Granularity controls how costs are grouped on the time axis (each bar or point on the graph represents one hour, one day, one week, or one month).
| Granularity | Date range |
|---|---|
| Hourly | Up to 35 days |
| Daily | 1 day to 3 months |
| Weekly | 1 week to 1 year |
| Monthly | More than 1 month |
If a granularity option is not available, shorten your date range.
Partial periods
When your time range does not align to week or month boundaries, Explorer shows partial periods at the edges.
Weeks always start on Monday and end on Sunday. For example, if you select all of January 2025 with weekly granularity, the first bar covers January 1 (Wednesday) through January 5 (Sunday) and the last bar covers January 27 (Monday) through January 31 (Friday). The three weeks in between are full Monday-to-Sunday weeks.
Months follow the same pattern. If you select November 15, 2024 through February 15, 2025 with monthly granularity, November and February are partial months, while December and January are full months.
When weekly or monthly granularity is selected, Explorer extends your date range slightly to include complete periods. This can cause the total cost displayed to differ from the exact dates you selected.
Visualization
Visualization controls change how the cost graph displays your data.
- Series: how many of your top-spending groups appear individually on the graph. The default is 10; switch to 5 or 25 to show fewer or more. Everything else combines into a single Other series on the graph. The cost table is not affected by this setting.
- Chart type: bar, line, or stacked line.
Graph interactions
Click a bar on the graph to add a filter for that element. This changes your query and updates both the graph and table.
The following controls adjust the graph visually without changing your query or the cost table:
- Click a legend item to show only that group on the graph
- Shift + click a legend item to remove that group from the graph
- Click and drag on the graph to zoom into a specific portion of the displayed time range
- Select Reset ( ↺ ) to revert the graph to its original state
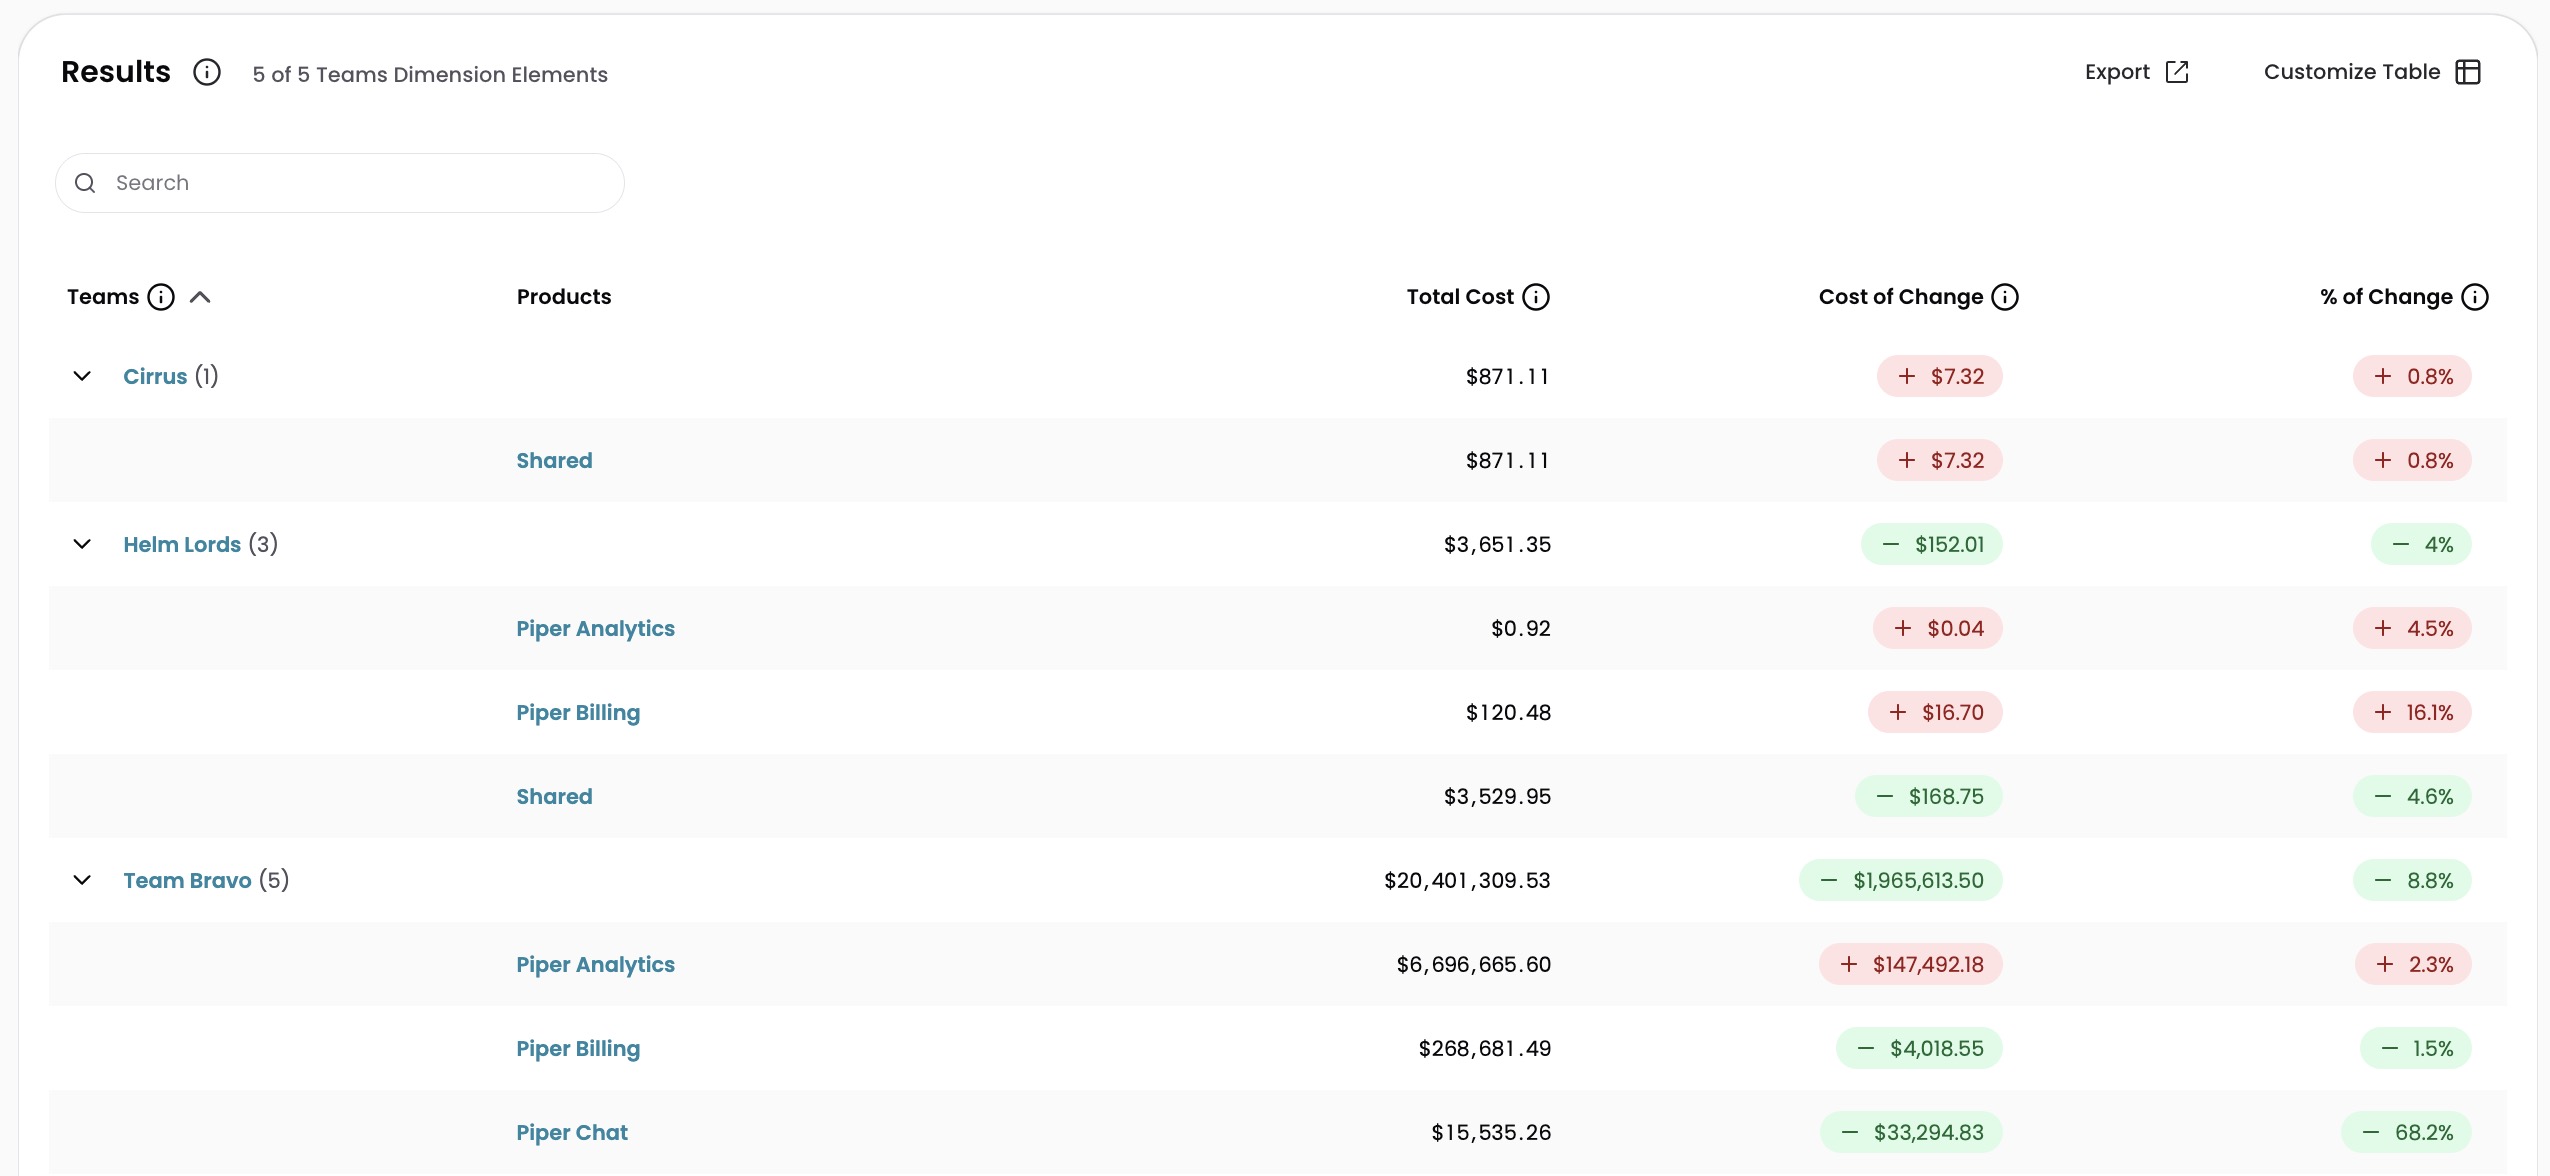
Customize the cost table
Focus the cost table on what matters to your analysis. Add comparison data, adjust density, and show or hide columns.
Select Customize Table above the results to open the customization panel.
- Analysis Data: add comparison columns to the table, such as Cost Trends
- Table density: switch between Default, Spacious, and Compact row heights
- Columns: toggle columns on or off, and drag to rearrange. You can also drag column headers directly in the table to reorder them, or drag a column out of the table to remove it
Table interactions
- Right-click a column header to pin, autosize, or rearrange columns
- Drag a column border to resize it
- Right-click a row value to open it in a new tab, copy it, or add it to your search filters
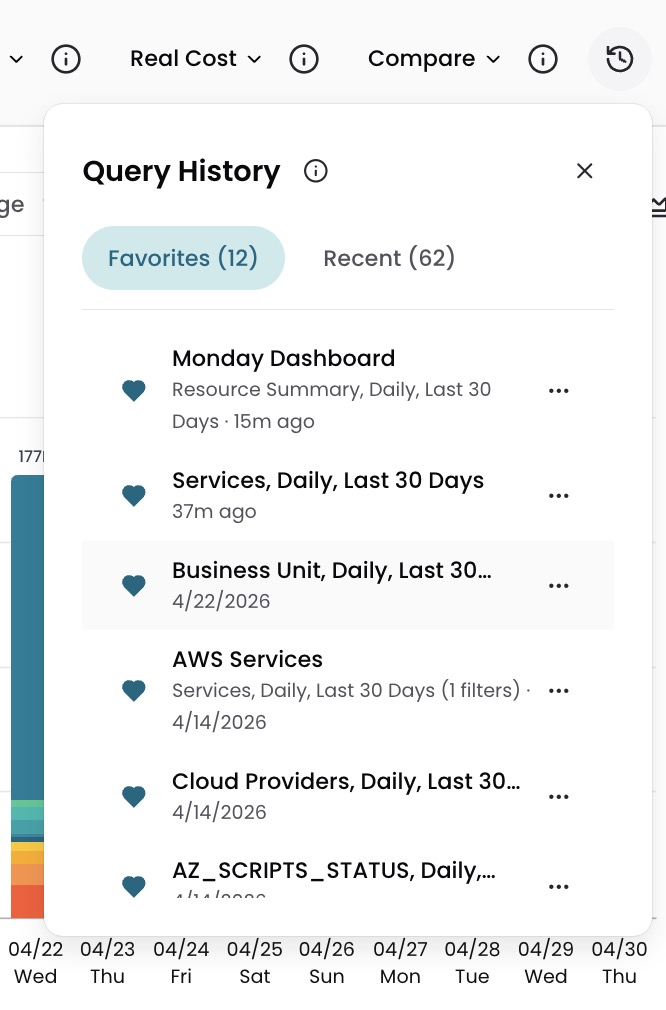
Query History and Favorites
Explorer saves every query you run, so you can return to any previous query without rebuilding it.
Click the Query History icon to open the panel:
- Recent: your queries in reverse chronological order. Click any entry to reload it.
- Favorites: up to 12 saved queries. Click the heart icon on a recent query to save it.
Have questions or feedback? Reach out to your account manager.
Updated 14 days ago