Kubernetes Efficiency Metrics in Explorer
See how efficiently your Kubernetes workloads use the resources they request. CloudZero shows CPU and memory efficiency alongside cost in Explorer, so you can identify right-sizing opportunities and optimize your Kubernetes spend.
CloudZero enables you to:
- View cost and resource usage grouped by cluster, namespace, and workload
- Compare requested CPU and memory to actual usage
- View GPU requests for GPU-enabled workloads
- Identify over-provisioned workloads through efficiency scores
- Drill down into specific workloads for detailed resource analysis
What you need
This feature requires the CloudZero Agent for Kubernetes. GPU request metrics require Agent v1.2.0 or above.
Viewing Kubernetes Efficiency Metrics
- Navigate to Explorer.
- In the Group By menu, select a Kubernetes Dimension: Cluster, Namespace, or Workload.
- The Kubernetes Efficiency columns appear in the cost table.
- Click any row to drill into that cluster, namespace, or workload and see its associated costs and resource profiles.
Filtering is limited to cluster, namespace, and workload Dimensions. If you apply filters on other Dimensions, the efficiency columns are omitted.
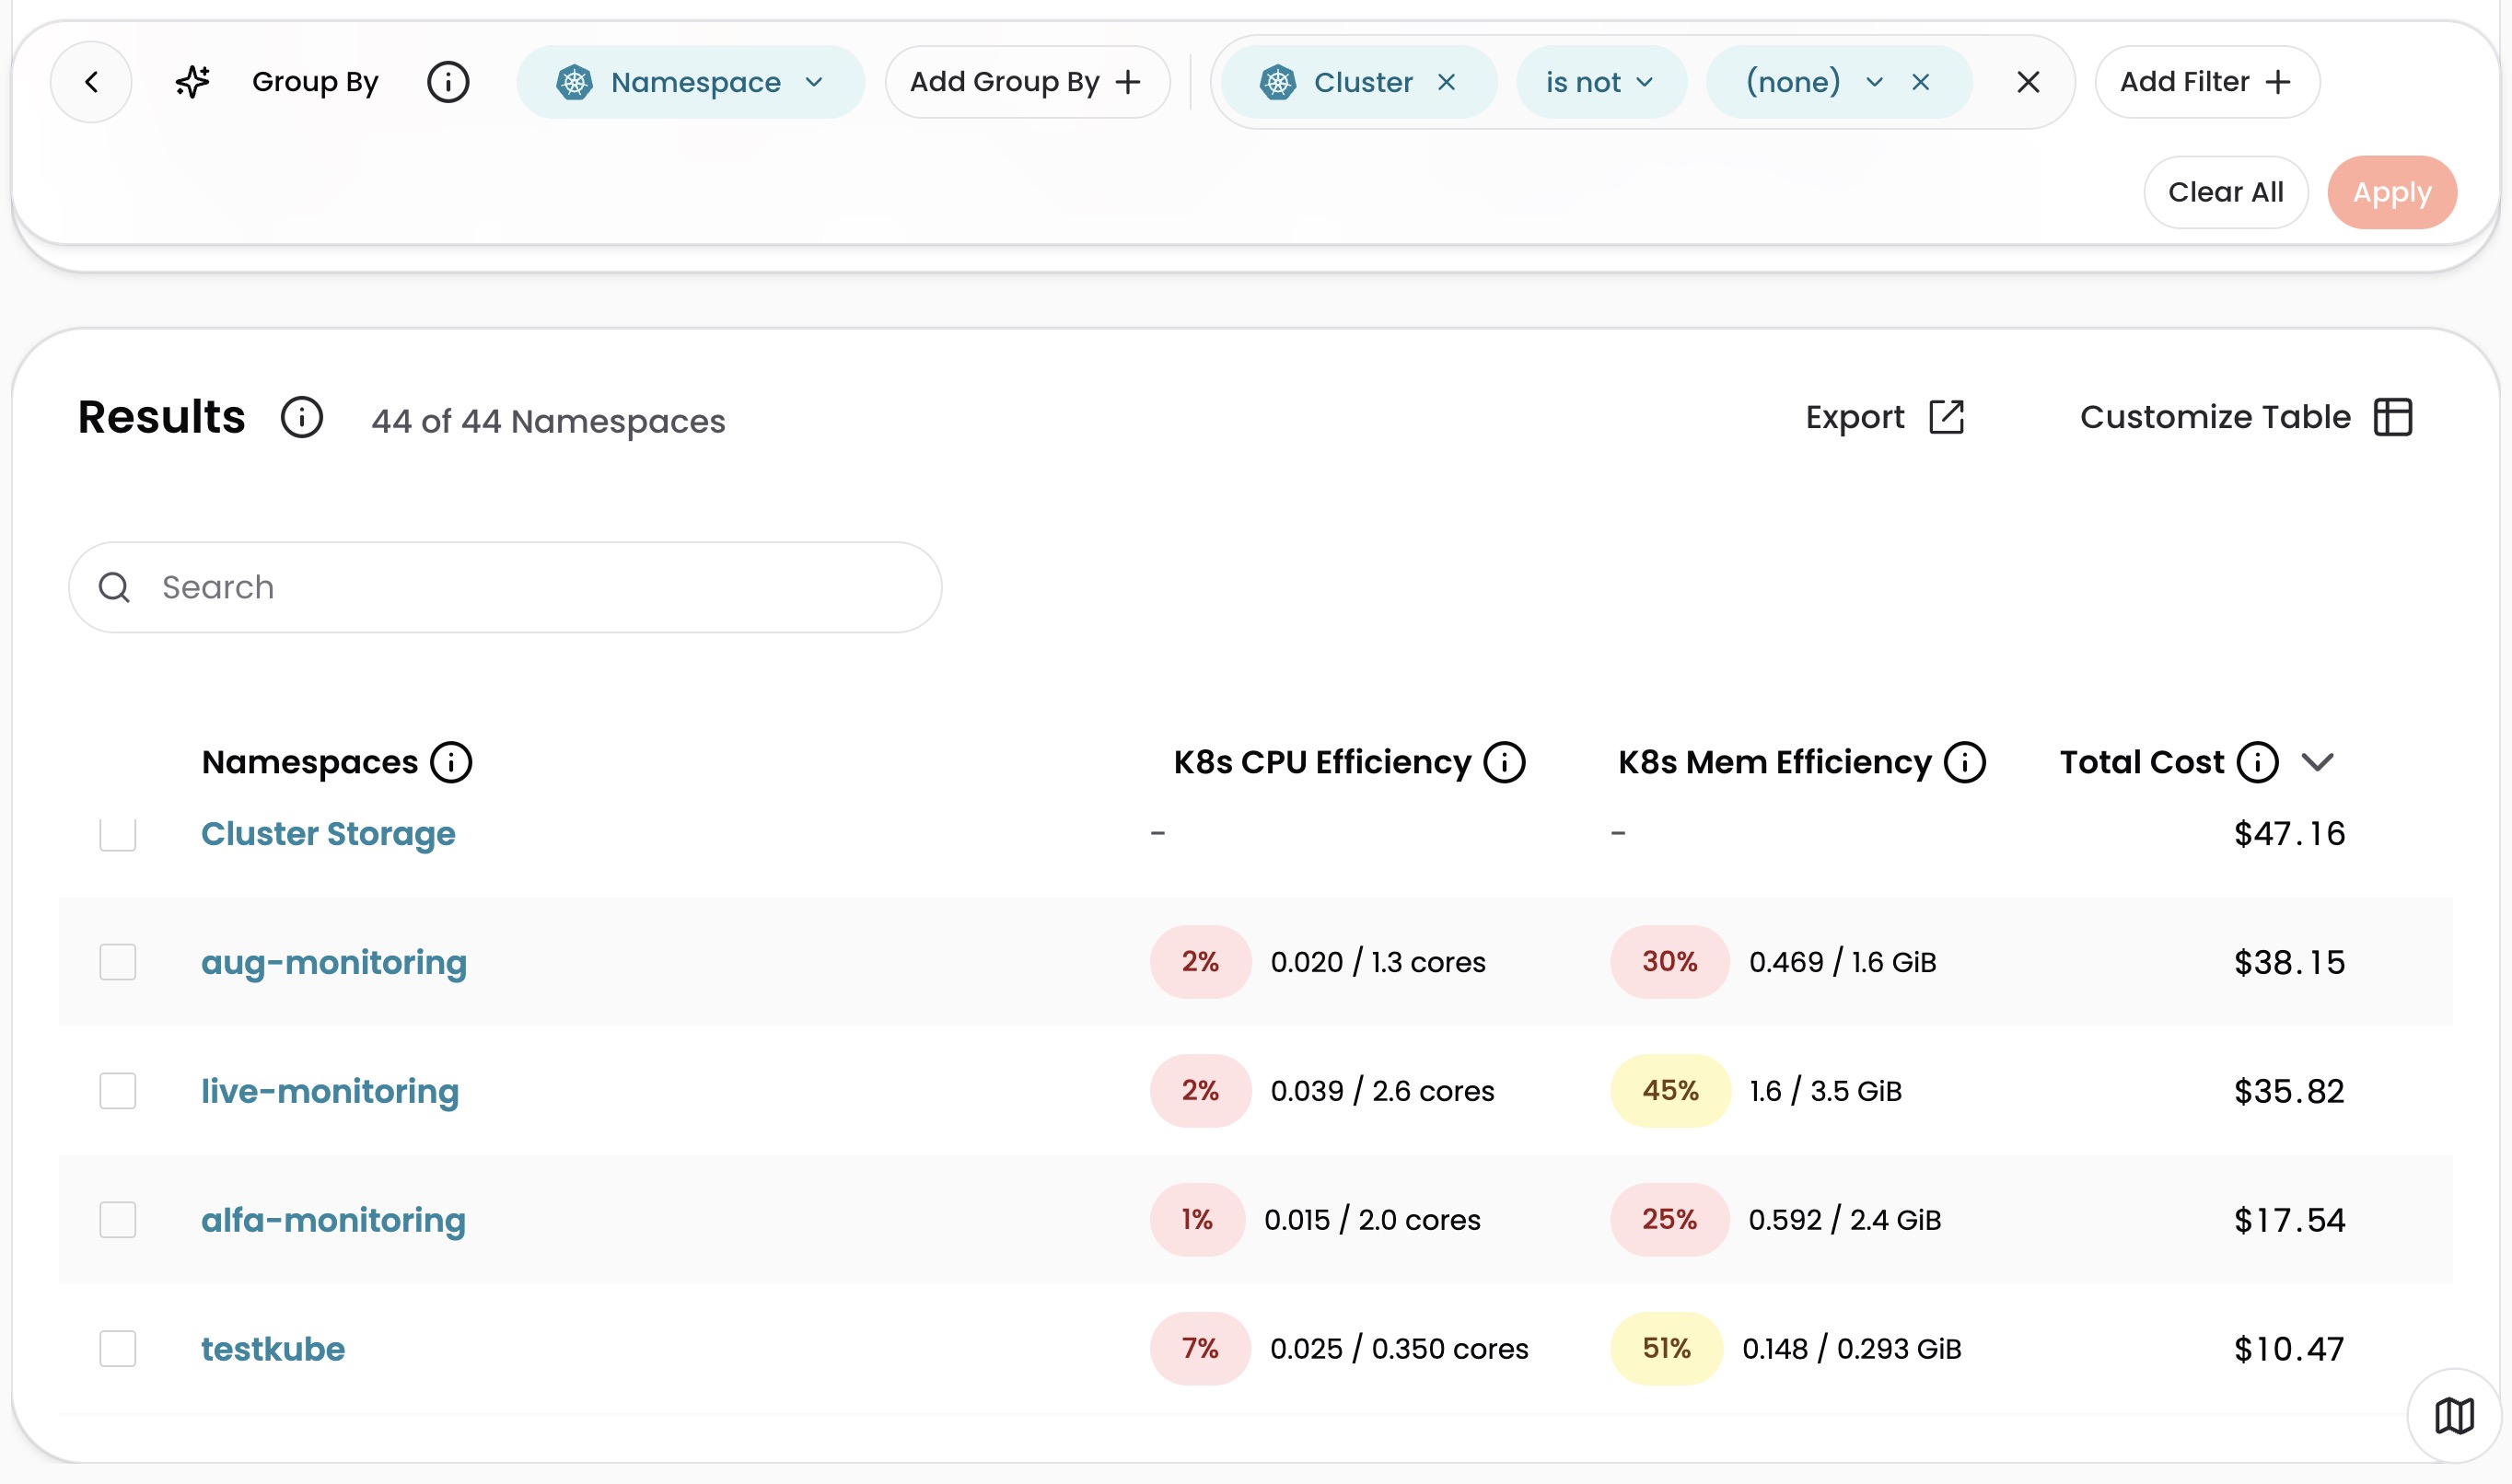
Example of Grouped by Namespace:
Available metrics
The Kubernetes Efficiency columns include:
| Metric | Description |
|---|---|
| CPU Efficiency | Usage divided by requests, shown as a percentage with color coding |
| CPU Usage | Smoothed average CPU consumed |
| CPU Requests | Time-weighted average of concurrent CPU resources requested across the period |
| Memory Efficiency | Usage divided by requests, shown as a percentage with color coding |
| Memory Usage | Smoothed average memory consumed |
| Memory Requests | Time-weighted average of concurrent memory resources requested across the period |
| GPU Requests | Time-weighted average of concurrent GPU resources requested across the period |
Understanding the efficiency scores
Efficiency is usage divided by requests, shown as a percentage. CloudZero smooths raw metrics to produce stable, actionable numbers, so values may differ from what you see in raw Kubernetes monitoring tools. For details on how the CloudZero Agent collects data, see Kubernetes.
- A workload requesting 4 CPU cores but using 2 has a CPU efficiency of 50% (yellow)
- A workload requesting 4 CPU cores and using 3.5 has a CPU efficiency of 87.5% (green)
Scores are color-coded:
- Green: 80% or higher
- Yellow: 50% to 79%
- Red: below 50%
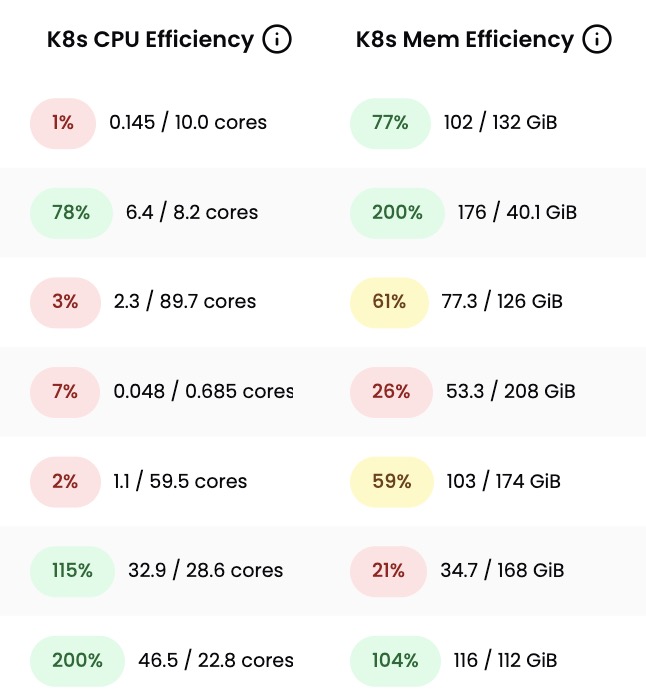
Efficiency is capped at 200% for display. If a workload uses more than it requests, the score is still green because over-usage is evaluated separately through Optimize recommendations.
Have questions or feedback? Reach out to your account manager.
Updated 2 months ago